Calendar Heatmap
Calendar Heatmap
A calendar heatmap.
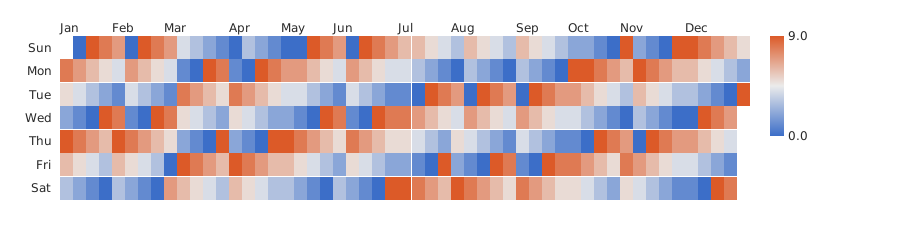
Usage
from dataviz_mojo import calendar_heatmap
from dataviz_mojo.plot import save

def main() raises:
    var dates = List[String]()
    var values = List[Float64]()
    var days_in_month: List[Int] = [31, 29, 31, 30, 31, 30, 31, 31, 30, 31, 30, 31]
    for month in range(1, 13):
        var month_str = "0" + String(month) if month < 10 else String(month)
        for day in range(1, days_in_month[month - 1] + 1):
            var day_str = "0" + String(day) if day < 10 else String(day)
            dates.append(String(2024) + "-" + month_str + "-" + day_str)
            values.append(Float64((day * 7 + month) % 10))

    var c = calendar_heatmap(dates, values, width=900, height=250)
    save(c, "docs/src/examples/out_calendar_heatmap.svg")
Args:
dates: Plain"YYYY-MM-DD"strings, one per entry, all in the same year (inferred fromdates[0]).values: Each date’s value, mapped through a continuous color gradient.theme: Full styling knobs beyond this function’s own parameters (colors, margins, fonts, gridlines, …) – seeTheme’s docstring.width: Pixel width of the returnedPlot(.size()).height: Pixel height of the returnedPlot(.size()).title: The chart’s title, shown above the plot.subtitle: A secondary line shown under the title.x_title: The x-axis caption.y_title: The y-axis caption.