Candlestick
Candlestick
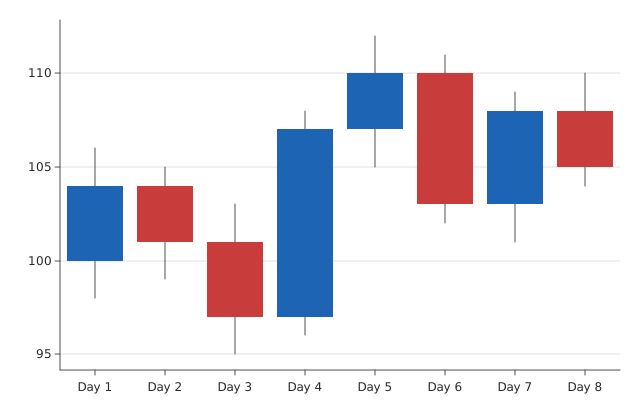
A candlestick chart.
Usage
from dataviz_mojo import candlestick
from dataviz_mojo.plot import save
from dataviz_mojo.theme import Theme

def main() raises:
    var days: List[String] = [
        "Day 1", "Day 2", "Day 3", "Day 4", "Day 5", "Day 6", "Day 7", "Day 8",
    ]
    var open: List[Float64] = [100.0, 104.0, 101.0, 97.0, 107.0, 110.0, 103.0, 108.0]
    var high: List[Float64] = [106.0, 105.0, 103.0, 108.0, 112.0, 111.0, 109.0, 110.0]
    var low: List[Float64] = [98.0, 99.0, 95.0, 96.0, 105.0, 102.0, 101.0, 104.0]
    var close: List[Float64] = [104.0, 101.0, 97.0, 107.0, 110.0, 103.0, 108.0, 105.0]

    var c = candlestick(days, open, high, low, close)
    save(c, "docs/src/examples/out_candlestick.svg")
Args:
categories: One bar per entry, in the given order.open: Each category’s opening value.high: Each category’s highest value – the wick’s top.low: Each category’s lowest value – the wick’s bottom.close: Each category’s closing value; the body is colored by whether it closed up (mark_color) or down (mark_color_negative) relative toopen.theme: Full styling knobs beyond this function’s own parameters (colors, margins, fonts, gridlines, …) – seeTheme’s docstring.width: Pixel width of the returnedPlot(.size()).height: Pixel height of the returnedPlot(.size()).title: The chart’s title, shown above the plot.subtitle: A secondary line shown under the title.x_title: The x-axis caption.y_title: The y-axis caption.