
Just because data CAN be captured doesn't mean it SHOULD be!
In a prior post about customizing the SiteCatalyst menu interface, I discussed how simple changes such as hiding empty Omniture variables/reports and re-organizing the menu structure will help improve understanding within your organization. In the spirit of even further interface optimization, here are 20 reports within Omniture that I feel that can be hidden due to their lack of business-actionable information.
Here are my Top 20, in no particular order:
- Mobile: Color Depth
- Mobile: Information Services
- Mobile: Decoration Mail Support
- Mobile: PTT
- Mobile: Device Number Transmit
- Mobile: Browser URL Length
- Mobile: DRM
- Mobile: Mail URL Length
- Mobile: Java version
- Mobile: Manufacturer
- Technology: Connection Types
- Technology: Monitor Color Depth
- Technology: JavaScript Version
- Technology: Monitor Resolutions
- Visitor Profile: Top-Level Domains
- Visitor Profile: Domains
- Visitor Profile: Geosegmentation
- Traffic Sources: All Search Page Ranking
- Traffic Sources: Original Referring Domains
- Custom Variable: s.server report
Mobile reports
For the most part, the information in the separate reports can determined just by knowing the device (which is also a default Omniture report). So, a single report can take the place of 10.
There’s also the pesky issue that the reports more often than not show “Unknown” for 90%+ of the mobile traffic (at least, in the U.S.). So not only can the data be determined from knowing the mobile device being used, the additional reports aren’t even well populated.
Technology reports
The “Connection Type” report, along with “Monitor Color Depth”, measure things that haven’t been an issue in too many years to continue reporting on. LAN, 16-bit or higher.
“Monitor resolution” is irrelevant in the face of also having “Browser Width” & “Browser Height” reports (the true size of the web page “real estate” on screen).
Finally, JavaScript version? The JavaScript report with “Enabled/Disabled” is likely more than enough information. Or, you can just include jQuery in your website and know with 100% certainty what version is being used.
Visitor Profile reports
My dislike of the identified Visitor Profile reports are due to halfway implementation. The “GeoSegmentation report shows a nice map representation, but only of traffic metrics like Page Views and Visits. Why not open this up to conversion variables and really make the visualization useful, instead of needing to rely on the “flat”, non-map Visitor Zip (s.zip) report?
For the “Domains” and “Top-Level Domains” report, you have granularity issues; the “Top-Level Domains” report is sort-of a country-level report, but the U.S. has several line items. The “Domains” report shows what ISP people are using to access the Internet (which I think is generally useless in itself), but again…it spans geography, so the ISP network someone is on may not even have the same technology. So what are we really measuring in these reports?
Traffic Sources reports
The “All Search Page Ranking” report seems like it could be useful, until you realize that 1) it aggregates all search engines (whose different algorithms provide different rankings and 2) with personalized search, rankings are no longer static. Literally every single person could see a different link position for the same search term. So while this report may have made sense for SEO measurement in the past, it’s really past it’s prime…use the right SEO tool for the job (Conductor, SEOmoz, and the like).
The “Original Referring Domains” report is weird in its own way…the absolute first URL that referred you to the site. Really? As Avinash has said, giving 100% credit to the first touchpoint is like giving your first girlfriend credit for you marrying your wife (paraphrased). This report is very limited in its usefulness IMO, especially given the advances in attribution modeling in the past several years.
Custom Variable: s.server report
The only custom variable report I have on this list is the s.server report; hopefully, all of your other custom variables are capturing only business-useful information!
The reason I dislike the s.server variable/report is the same reason I dislike the “All Search Page Ranking” report; use the right tool for the job. This is a lazy way of monitoring server volume for load balancing. But if you’re doing the job well on the back-end, shouldn’t every server have the same level of volume?
Even if the answer to the previous question is no (I’m not a network engineer, clearly), having an operational report like this doesn’t make much sense to me in a marketing reporting tool.
By hiding reports in the Omniture menu interface, this doesn’t mean the info stops being collected or becomes unavailable to all users. Rather, the option to use the reports isn’t immediately obvious (since they don’t show up in the menu). Power Users can still find these reports using the search box if necessary to answer an oddball question.
But in my experience, the information in these reports are generally not business useful, or are lacking in some critical way. If you can’t make regular, high impact decisions with the info, then you’re better off never looking at it at all.
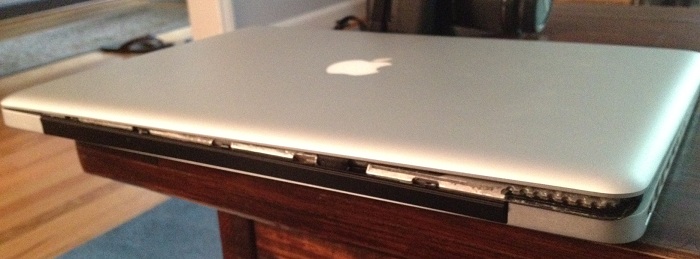
Broken MacBook Pro hinge (due to glue failure)
I used to think that when people talked about the “legendary Apple customer service” that there was plenty of hyperbole thrown in for good measure. Until it happened to me with my broken MacBook Pro hinge.
“Broken MacBook Pro Hinge” - Plenty of search results
When the screen on my late 2008 15” MacBook Pro started separating from the hinge, the first thing I did was search Google. There I found more than enough search results to make me believe this was a widespread issue with this vintage of laptop. And since the laptop was out of warranty, most of the results talked about re-gluing the aluminum screen cover to the hinge.
After trying to re-attach the hinge to the screen using epoxy, I headed over to the Apple store in King of Prussia, PA. To say this first encounter at the Genius Bar was frustrating is an understatement.
You should’ve bought AppleCare
Apple cashiers “Geniuses” and fanboys alike are very big on pushing the AppleCare warranty, selling you with tales that Apple will fix anything in that extended time period. While that may be true, extended warranties generally don’t pay off for the consumer, and as such, I don’t buy them.
Not that it would have mattered for me anyway. My MacBook Pro is well beyond 3 years old, one of the first unibody models that came out. You think the Apple “Genius” would’ve known that after checking the serial number, but instead just kept repeating robotically:
“You should’ve bought AppleCare. You should’ve bought AppleCare.”
Even when I asked, “A glue failure doesn’t seem like a manufacturers defect?” or “I should’ve paid $349 for an extended warranty to protect against $0.05 of faulty glue?”
“You should’ve bought AppleCare.”
At that point, after being asked if I dropped the laptop, given a series of robotic answers, suggested that I should’ve spend $349 that wouldn’t have fixed my problem, and generally treated like a monkey, I felt like smashing the laptop right on the Genius Bar just to make a scene. Instead, I walked out feeling worse than when I arrived, with crippled MacBook Pro in hand.
Maybe an Apple Certified Repair facility can help
Since I wasn’t going back for a second round of stupidity at King of Prussia Apple Store, I decided to look up an independent shop to see what the cost of repair would be. The repair guy immediately said “Oh, I’ve seen this a few times recently…it’s probably around $500-$600 to fix.”
$%^$&%*(#! For $600, I’d be about 30-35% of a new 15” MacBook Pro. Again I left a store without doing anything, and feeling worse than when I arrived. I either need to pay $600 or pay $2000+ to get the newer equivalent of my laptop.
One more trip to the Apple Store
Several weeks had passed and my laptop became pretty much unusable. I decided to bite the bullet and pay to get the screen fixed. I also decided to go back to an Apple Store (this time, in Ardmore, PA) to have them fix it. I figured if I’d have to pay, might as well guarantee it would get fixed properly.
When I walked up to the Genius Bar, the Apple “Genius” still asked me if I dropped my laptop (sidebar: Is this part of the mind tricks they give everyone? There isn’t a scratch on the thing, let alone any dents). After the Apple employee looked over the laptop, I told him in my most dejected voice that I wanted to find out how much is was to replace the screen.
Apple Genius: “How about ‘free’?”
I damn near fell off the stool I was sitting on. How could the Apple Store in King of Prussia been so unhelpful, and then 5 minutes into the same explanation I get an offer to get the screen fixed FREE at the Suburban Square Apple Store in Ardmore?
Apple Genius: “And we can probably get this back to you by tomorrow.”
Needless to say, I didn’t want to do anything except hit ‘Accept’ on the electronic repair form. I’ve come too far to mess this gift up!
Apple, you’ve earned yourself a lifetime customer
Maybe I got lucky. Maybe it was perseverance. Maybe this screen/hinge defect has shown up too many times in the last six weeks and Apple could no longer ignore it.
Maybe it’s because I asked twice at two different Genius appointments. Or maybe Apple has realized I’ve spent several thousand dollars with them in the past several years, with this MacBook Pro, iMac, several iPhones and an iPad. That level of spend probably doesn’t even get me in the top 50% of non-business customers, but it’s not negligible either.
Whatever the reason, by comping me the $492.41, Apple has “bought” themselves a customer for life.
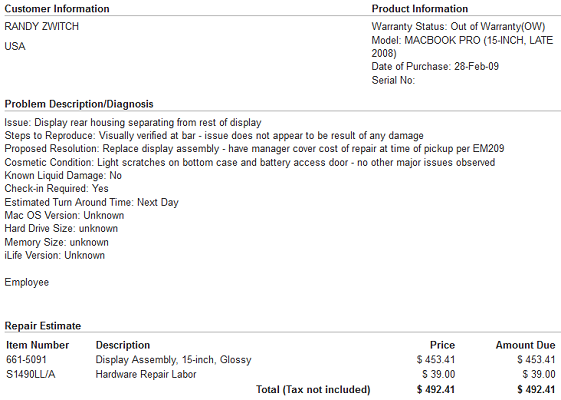
The cost of a broken MacBook Pro hinge? Apparently, $492.41!
Edit: To read the follow-up of what eventually ended up of this MacBook Pro, click here for an article about me replacement battery interaction with Apple.
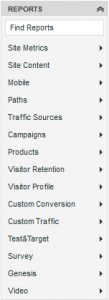
Default Omniture report menu
Visits vs. Visitors vs. Unique Visitors…click-throughs, view-throughs, bounces…these concepts in digital analytics are fairly abstract, and many in business and marketing never really grasp the concepts fully. Knowing the enormous amount of learning that needs to take place for digital success, why do we make our internal stakeholders hunt for data that’s organized by TOOL definitions, instead of by business function?
In this case, the “tool” that I’m referring to here is Omniture SiteCatalyst. To be clear, there’s nothing excessively wrong about the default menu structure in Omniture, just that in my experience, understanding by end-users can be greatly enhanced by customizing the Omniture menu.
Simple modifications such as 1) Hiding Omniture variables and products not in use, 2) organizing reports by logical business function, and 3) placing custom reports and calculated metrics next to the standard SiteCatalyst reports will get users to making decisions with their data that much faster.
1) Hide Omniture variables and products not being used
Do your users a favor and hide the Omniture products such as Test & Target, Survey, and Genesis if you aren’t using them. Same thing with any custom traffic (props) and custom conversion variables (eVars) that aren’t being used. Nothing will distract your users faster than clicking on folders with advertisements (T&T, Survey) or worse, frustrate the user by making them wonder “What data is supposed to be in this report?”
Just by hiding or disabling these empty reports and tools advertisements, you should see an increased confidence in data quality. Or at the very least, keep the conversation from taking a detour.
2) Organize SiteCatalyst reports by logical business function
Your internal users aren’t thinking about Omniture variable structures when they are trying to find the answer to their business questions. So why do we keep our data artificially separated by “Custom Events”, “Custom Conversions” and “Custom Traffic”?
Worse yet, who remembers that the number of Facebook Likes can be found at “Site Metrics -> Custom Events -> Custom Events 21-30?” And why are Facebook Likes next to “Logins”? Does that mean Facebook Logins? Probably not.
Wouldn’t it be better for our users to organize reports by business function, such as:
- Financial/Purchase Metrics (Revenue, Discounts, Shipping, AOV, Units, Revenue Per Visit)
- Usability (Browser, Percent of Page Viewed, Operating System)
- SEO (Non-campaign visits, Referring Domains)
- Mobile (Device, browser, resolution)
- Site Engagement (Page Views, Internal Campaigns, Logins)
- Site Merchandising (Products Viewed, Cart Add Ratio, Cross-Sell)
- Social (Facebook Likes, Pinterest Pins, Visits from Social domains)
- Paid Campaigns (Email, Paid Search, Display)
- Traffic (Total Visits, Geosegmentation)
The list above isn’t meant to be exhaustive, or necessarily how you should organize your SiteCatalyst menus. But for me, organizing the reports by the business function keeps my business thinking flowing, rather than trying to remember how Omniture was implemented by variable type.
3) Place custom reports and calculated metrics next to the standard SiteCatalyst reports
This is probably more like “2b” to the above, but there’s no reason to keep custom reports and calculated metric reports segregated either. Custom reports happen because of a specific business need, and the same thing with calculated metrics. By placing these reports along with the out-of-the-box reports from SiteCatalyst, you take away the artificial distinction between data natively in SiteCatalyst and business-specific data populated by a web developer.
Why you wouldn’t want to customize?
Shawn makes two great points in his post about (not) customizing the SiteCatalyst menu: users require special training and menu customization isn’t scalable.
Users need special training
Users need to be trained anyway. I don’t think either of us is suggesting moving all of the menus around after an implementation has been in place for years…but if you’re a company just starting out, why not start off customized?
Fellow Keystoner Tim Patten also commented to me via Twitter DM about power users being used to “default”, and it’s annoying have to learn a new menu when switching companies; I’m not really worried about power users, I’m thinking about the hundreds of users in thousands of organizations who can’t get beyond page views and visits. Power users can pick up a new menu quickly, switch back to default, or use the search box.
This is very much true. The larger the company, and the more complex and varied the tracking, inevitably menu customization isn’t particularly scalable. This is probably an area where specific dashboards are a much better strategy than customizing the menus.
Summary
For me, one of the first things I look for when working with a company looking to get their digital analytics program off the ground is whether they’ve customized their Omniture menu structure. As a free customization, it’s something that companies should at least consider. Organizing reports by business function requires a business to think about the questions they want to regularly answer, will keep novice users from focusing on implementation concepts, and overall is just better because it’s how I think 🙂
This blog post is a continuation of a Twitter conversation with Shawn C. Reed (@shawncreed), Jason Egan (@jasonegan), Tim Patten (@timpatten) and others. Shawn’s counter-argument can be found here. Jason wrote about Omniture menu customization a few years back. And finally, if you want to read more pros-and-cons about SiteCatalyst menu customization, see the Adobe blog posts here and here.