I released version 1.4.12 of RSiteCatalyst before I wrote the release notes for version 1.4.11, so this blog post will treat both releases as one. Users should upgrade directly to version 1.4.12 as the releases are cumulative in nature.
Get* method additions
Two Get* methods were added in this release: GetClickMapReporting and GetPreviousServerCalls, mostly for completeness. Analytics users will likely not need to use these methods, but they are useful for generating documentation.
Bug fixes
Fixed GetLogin function, adding selected_ims_group_list parameter to response (caused test suite failure)
Fixed issue with ViewProcessingRules where nested rules threw errors (#214)
Fixed issue with GetMarketingChannelRules where nested rules threw errors, matches column duplicated values across rows (#180)
Added ability to use a segment in QueueDataWarehouse function, which was previously implemented incorrectly (#216)
Fixed issue with QueueDataWarehouse not returning the proper number of results when enqueueOnly = FALSE
Fixed encoding for QueueDataWarehouse to correctly use UTF-8-BOM (#198)
Fixed parser for GetFeeds, to unnest ‘activity’ data frame into discrete columns
Fixed issue where message Error in if (!is.null(elements[i, ]$classification) && nchar(elements[i, : missing value where TRUE/FALSE needed displayed when using multiple elements in a Queue* function (#207)
Community Contributions (An Adobe Summit bounce?!)
In the past month, the number of GitHub issues submitted has increased dramatically, a good problem to have!
I encourage all users of the software to continue reporting bugs via GitHub issues, and especially if you can provide a working code example. Even better, a fix via pull request will ensure that your bug will be addressed in a timely manner and for the benefit to others in the community.
I’ve written several posts about the Adobe Analytics Analytics (née Clickstream) Data Feed (links: 1,2,3) over the past several years. The Analytics Data Feed is an invaluable tool for moving beyond aggregate-level reporting information about your customers to really in-depth, customer-level analytics.
While the Analytics Data Feed is nowhere as easy to use as the Adobe UI, Report Builder, Analytics Workspace or even RSiteCatalyst, the hardest part for me when I was a digital analytics consultant was just obtaining the files in the first place (to say nothing of restarting a failed feed)! Luckily, Adobe has now built an interface accessible by any Adobe Analytics admin, removing the need for ClientCare to set up and maintain feeds.
In this post, I will briefly highlight how to set up an Analytics Data Feed from inside Adobe Analytics and give my impressions of the tool (as it exists at the time of writing). Note this post is not meant to be a substitute to the official documentation; Adobe provides detailed information about the entire process in their Help section.
Landing the Files via FTP/SFTP/S3
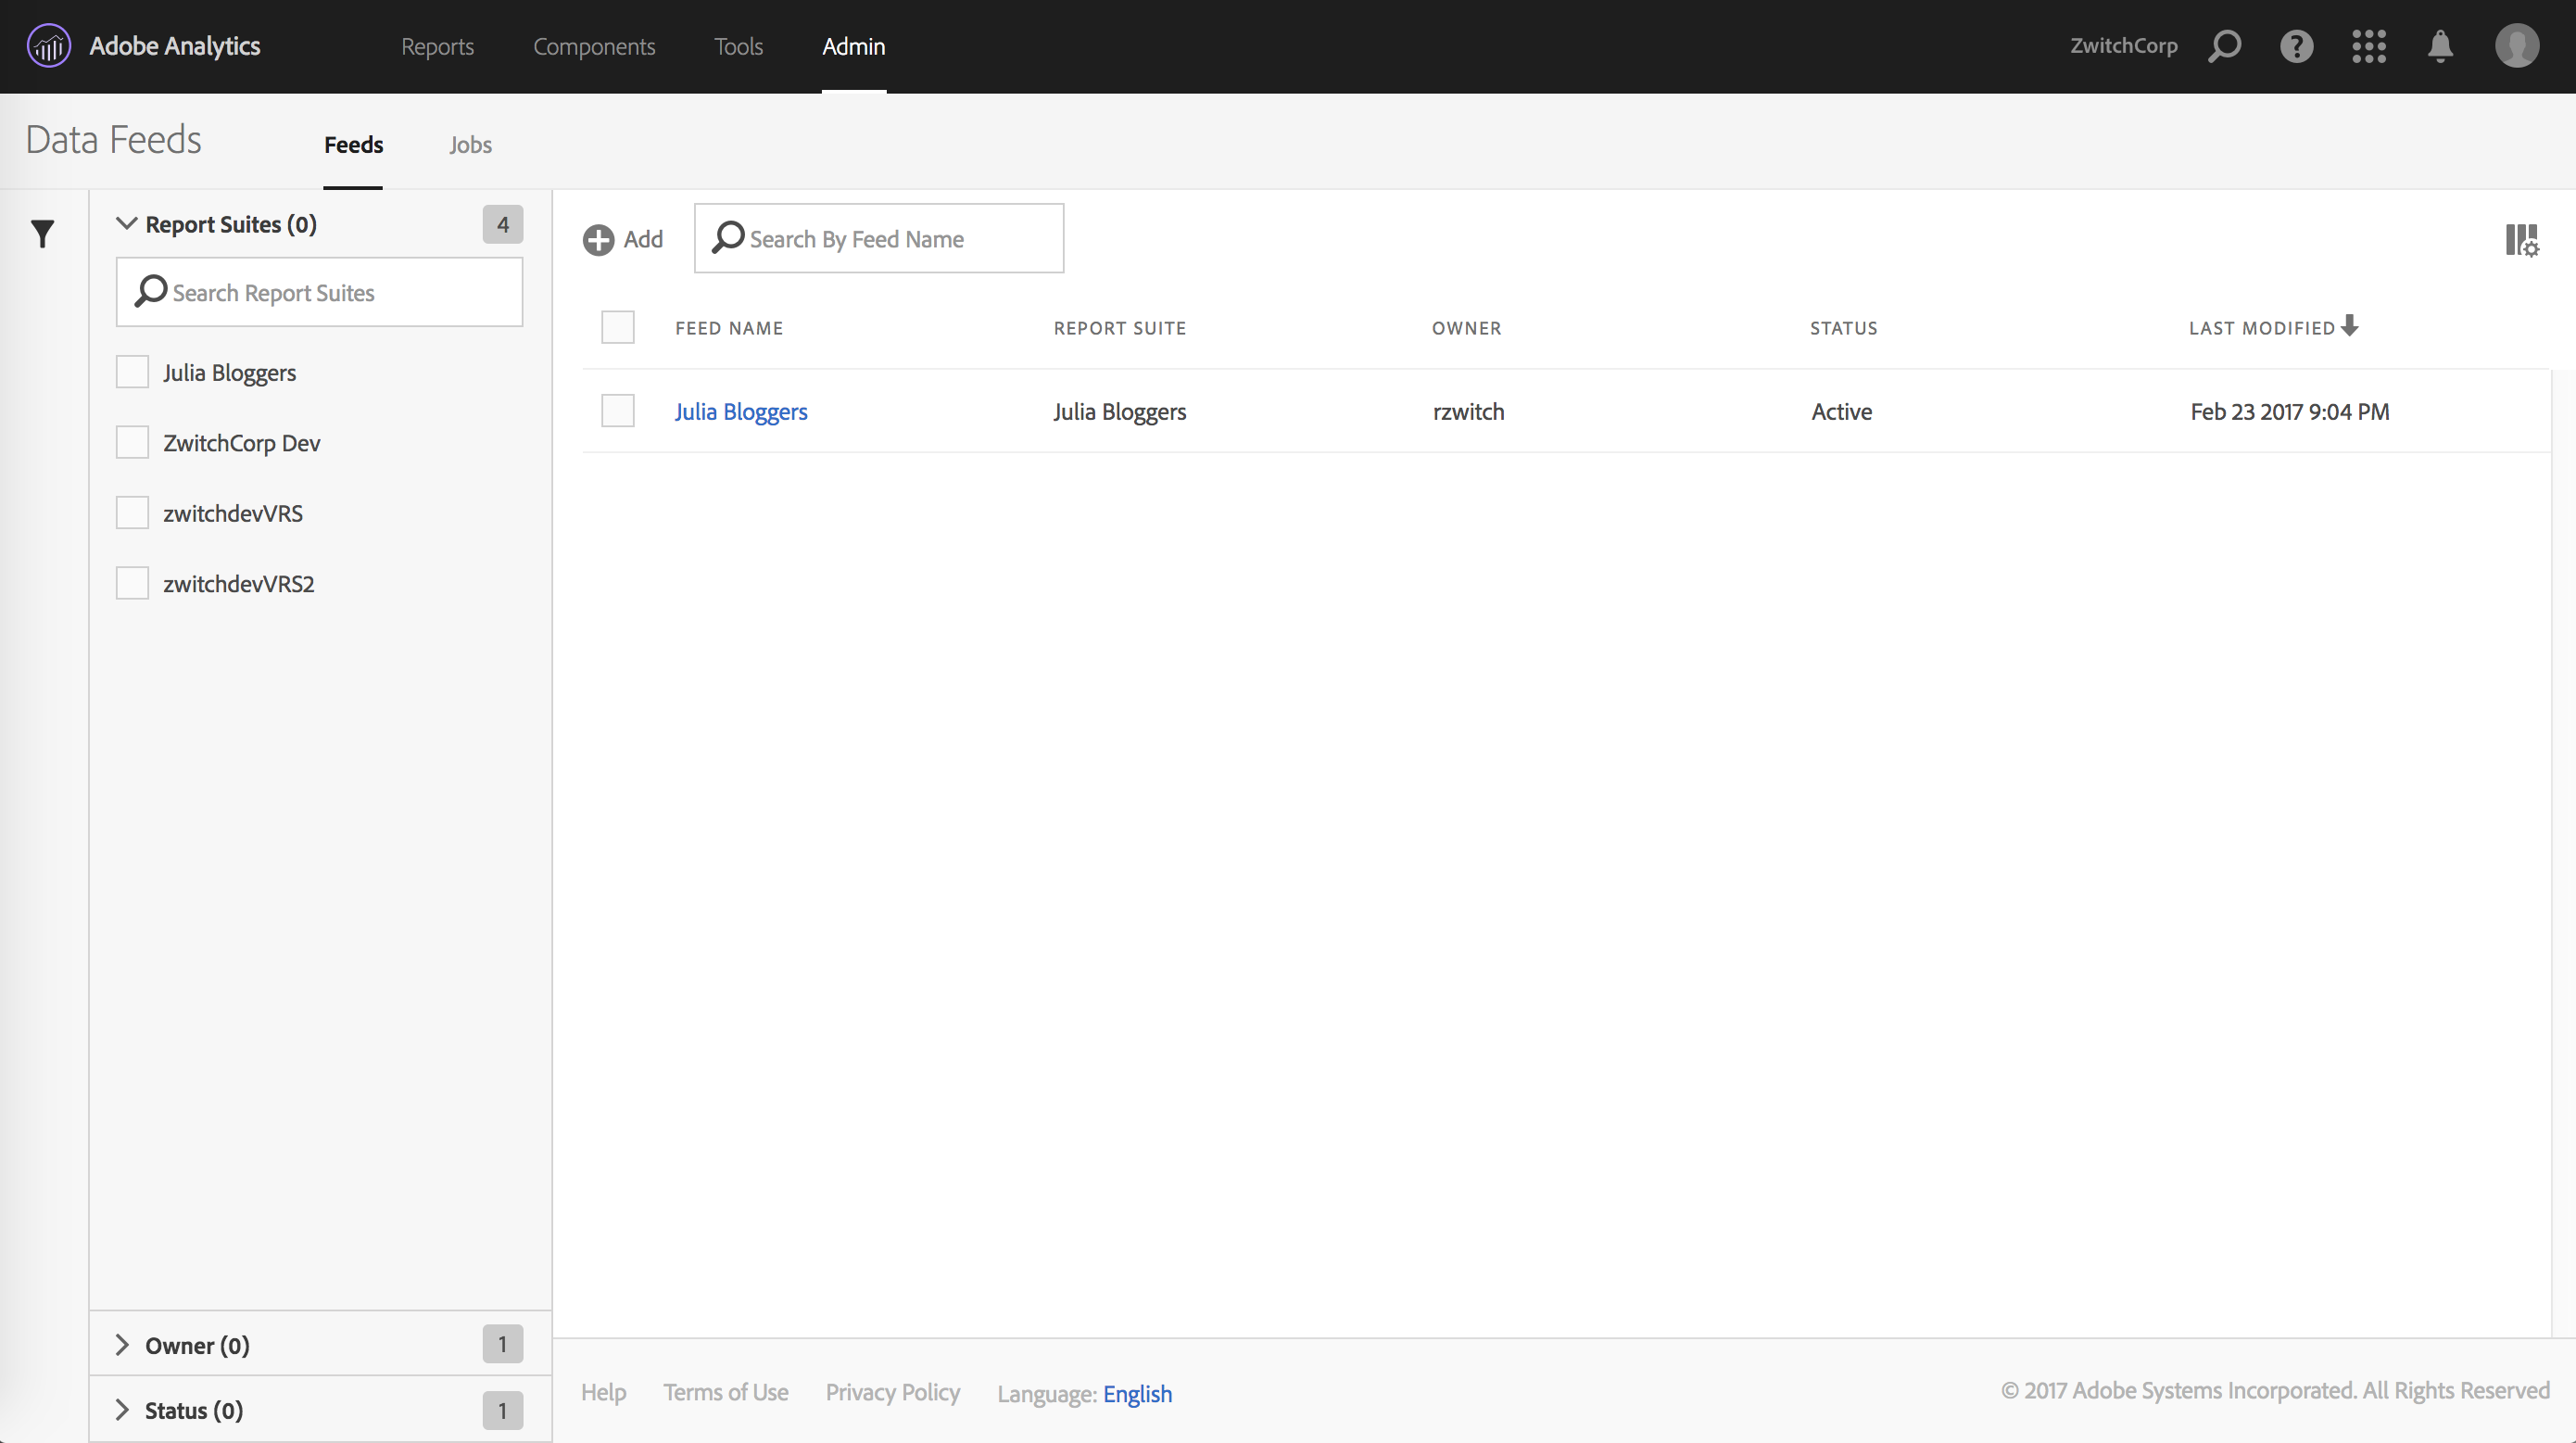
After clicking ‘Admin -> Data Feeds’ in the Adobe Analytics Admin menu/panel, you should see an interface similar to the following:
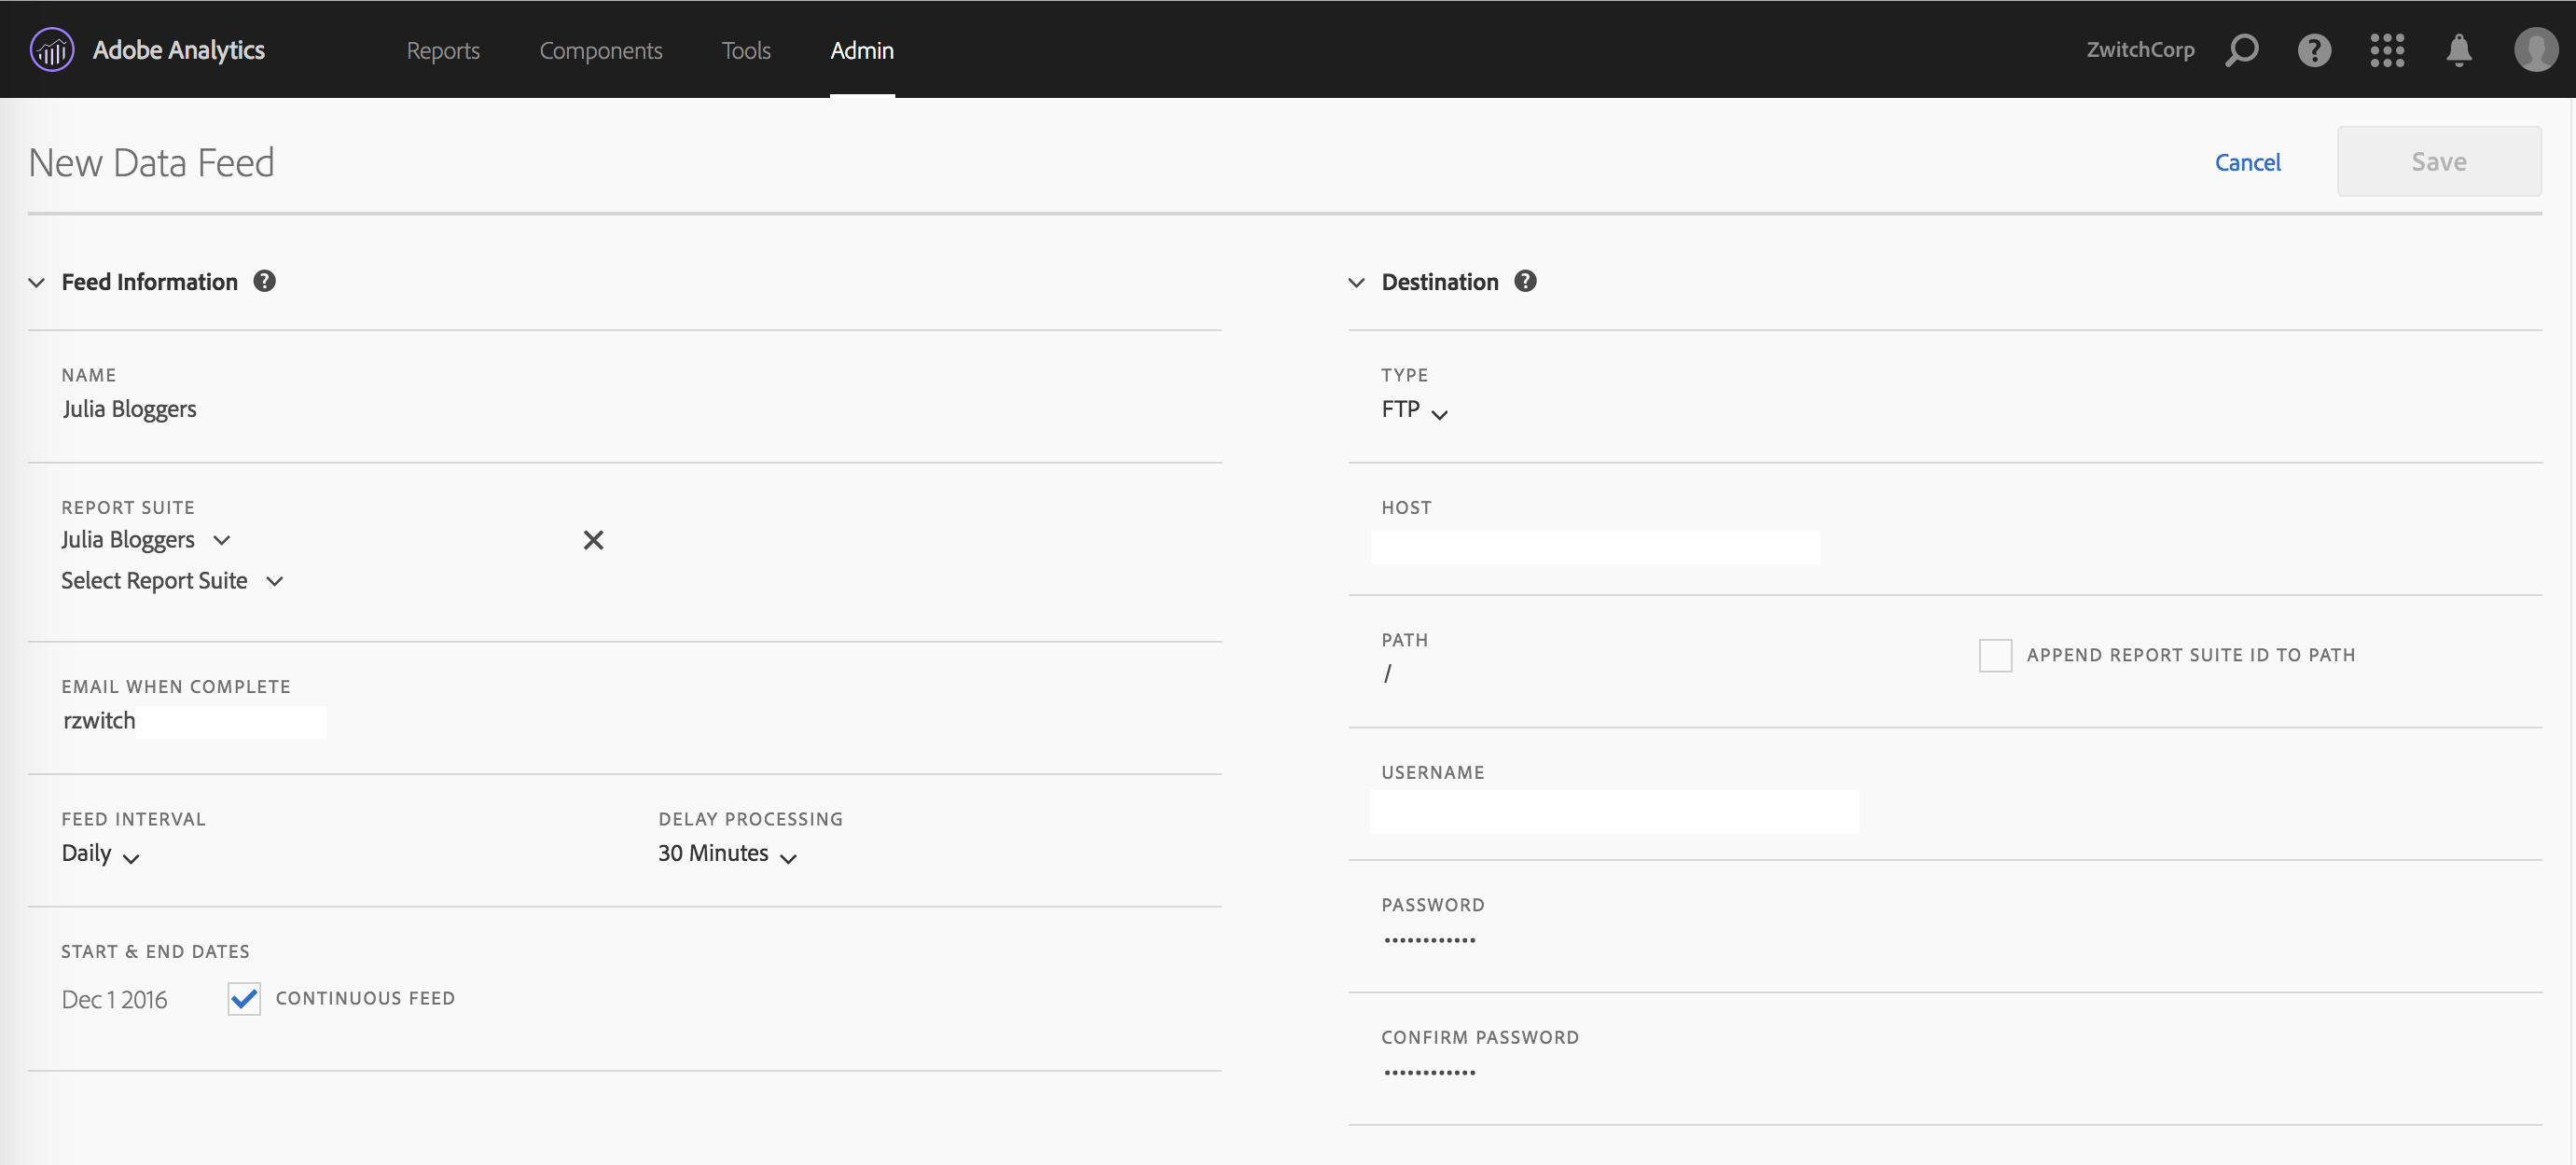
After clicking the “(+) Add” button, you will be brought to a page with three parts: Feed Information, Delivery Location and Data Column Definitions. The top half of the page looks as follows:
I find these two panels fairly self-explanatory. On the left, you give your data feed a name, choose the report suite(s) you want the data feed for, pick the delivery granularity, then choose the start/end date or choose ‘continuous’ for indefinite future delivery. On the right side, you provide your server information, FTP/SFTP or Amazon S3.
There are several things I love about this setup:
Delivery via SFTP and S3: For the longest time, FTP was the only choice, which disappointed security-minded folks who wanted SFTP. With S3 delivery, you can house your data files and read them into Hadoop directly (assuming you use AWS); this means you don’t necessarily have to do anything with the data until you need it, then you can fire up an EMR job to get your data. Dump the cluster when you’re done. Nice.
Multiple Report Suites, same window: I’m so happy to see that this interface supports choosing multiple report suites within the same “feed”. This makes it so much easier than having to create a separate feed instance, when in many cases the settings will stay the same (other than report suite of course).
What I don’t love:
Not saving FTP information: When you do choose to create separate feeds, there doesn’t appear to be a way to use the same credentials without typing them in yourself. Not a huge deal if your password is “Mom”, a little more annoying if you auto-generate a password that looks like “aHR0cDovL3JhbmR5endpdGNoLmNvbQ==”
Data Column Definitions
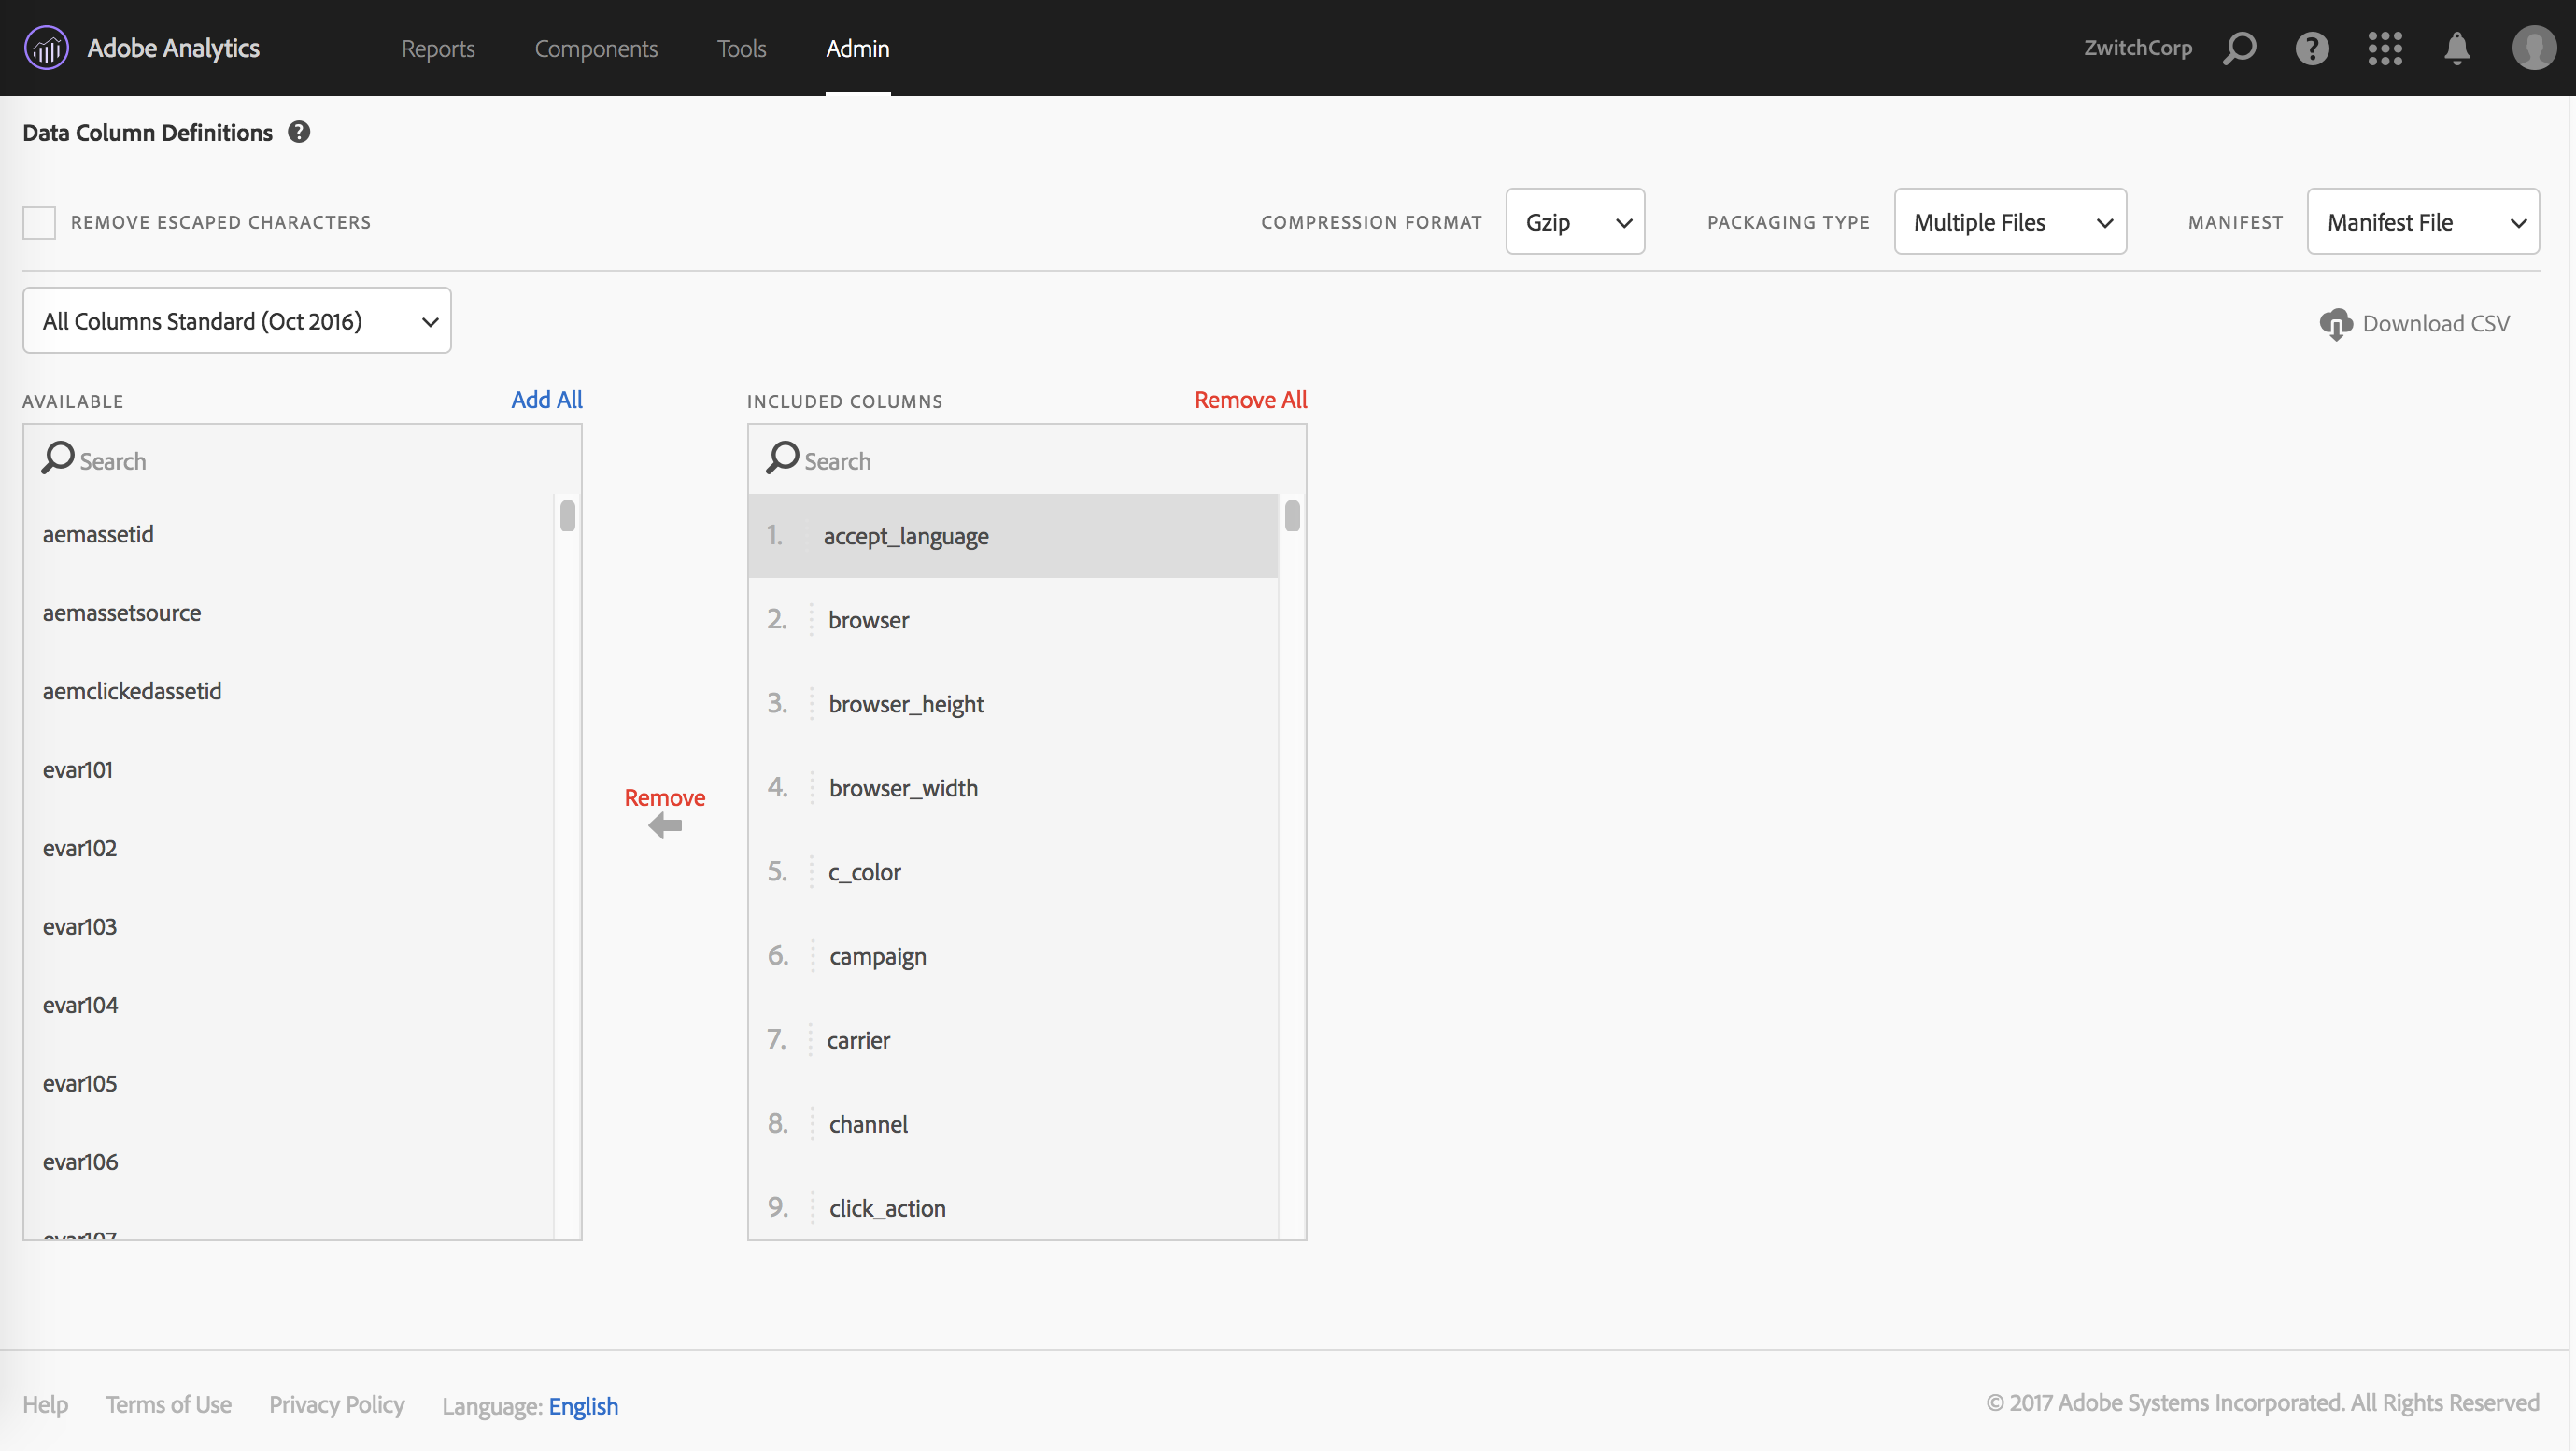
After choosing the report suites and providing the delivery details, the remaining step is to decide which data fields you want as part of the data feed. Luckily, there are templates that can be chosen, so that the user doesn’t have to remember every single field and the order that they need.
My favored practice when working with the data feeds is to have every feed have the same structure, even if certain report suites don’t have nearly the same amount of eVars and props implemented. I’m of the mind that taking all the fields, then letting the ETL process handle what to do with the data is much less error-prone. You can always re-run an ETL process if you forgot something; if you forget a column in your data feed, you need to re-process all of the feeds.
Empty columns are also much less wasteful in the age of distributed computing (such as Hadoop), as columnar data formats/databases remove much of the performance penalty of empty columns. Using dictionary encoding and columnar data structures, you can represent an entire column of missing values as {NA: } and spend mere bytes for data storage and still have lossless compression.
Save and Repeat
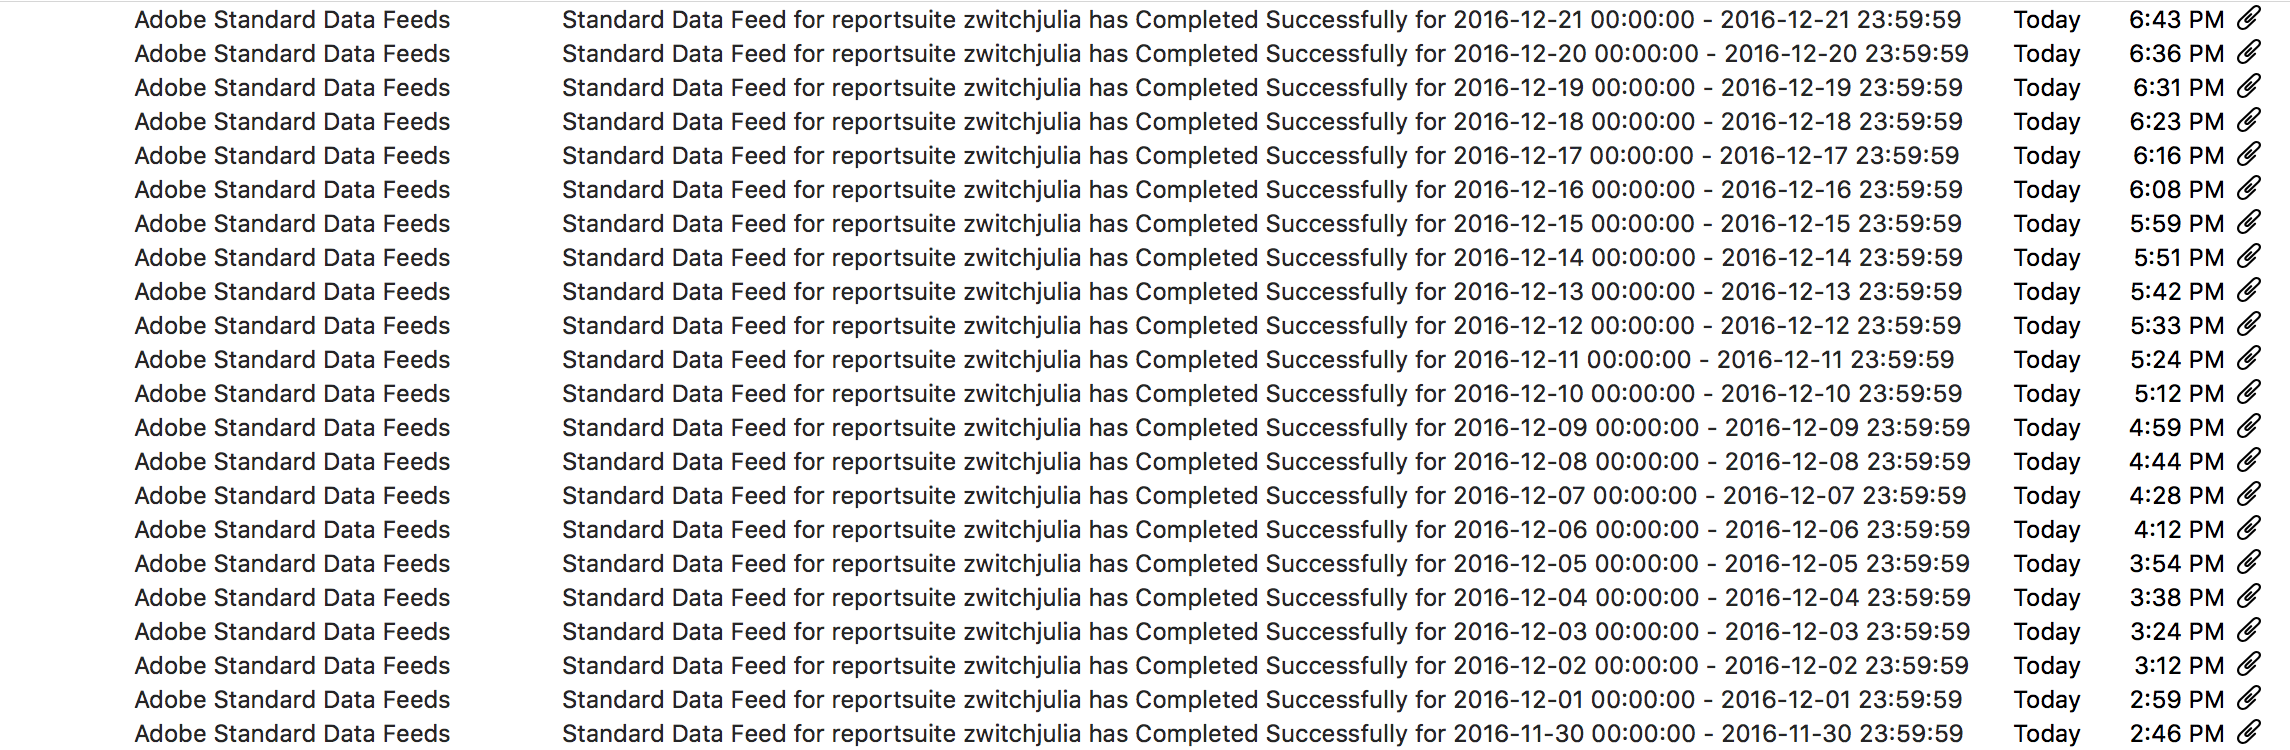
Once you have your data feed defined, you save your work and that’s it! I’m not sure what SLA might be in place, but it seems like there’s roughly a 48-hour delay between submitting a new feed and having the data start to process. Once the processing starts, your notification inbox will quickly look like this:
Automated Monitoring with RSiteCatalyst
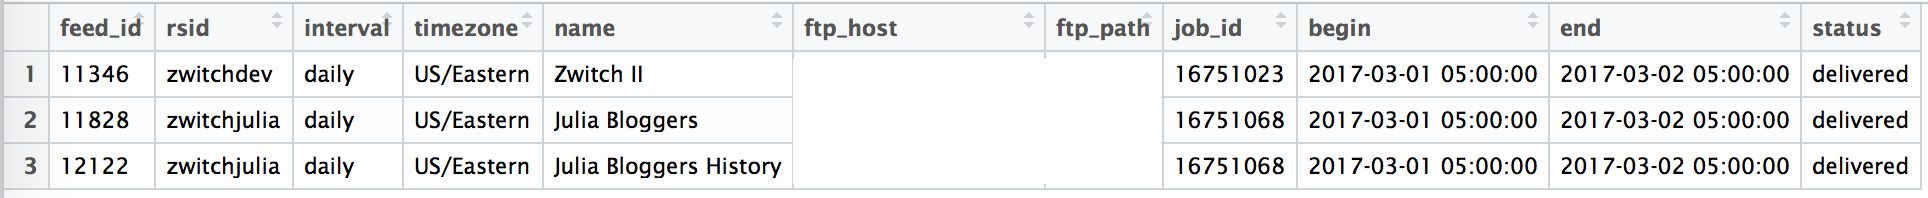
If you want to have more control around monitoring than just staring at your inbox, you can use RSiteCatalyst to get the processing status of your feed:
1
2
3
4
5
6
7
8
9
10
library(RSiteCatalyst)#Authentication (assumes credentials saved in .Renviron)SCAuth(Sys.getenv("USER",""),Sys.getenv("SECRET",""))#Get full list of report suitesrs<-GetReportSuites()#Pass in all non-virtual report suitesfeedstatus<-GetFeeds(rs[is.na(rs$virtual),]$rsid)
GetFeeds will return a dataframe that returns the feed information, as well as the processing status:
It’s not hard to imagine what a cronjob would look like, polling the Adobe API every few minutes to see which feeds are complete, then kicking off an ETL process.
Data, Liberated!
This blog post has been relatively light on code and analysis, but I hope I’ve highlighted that the barriers to obtaining the most granular data Adobe can provide have been completely removed. With the new Analytics Data Feed interface, the possibility of bespoke customer analytics is only a few button clicks and an FTP away.
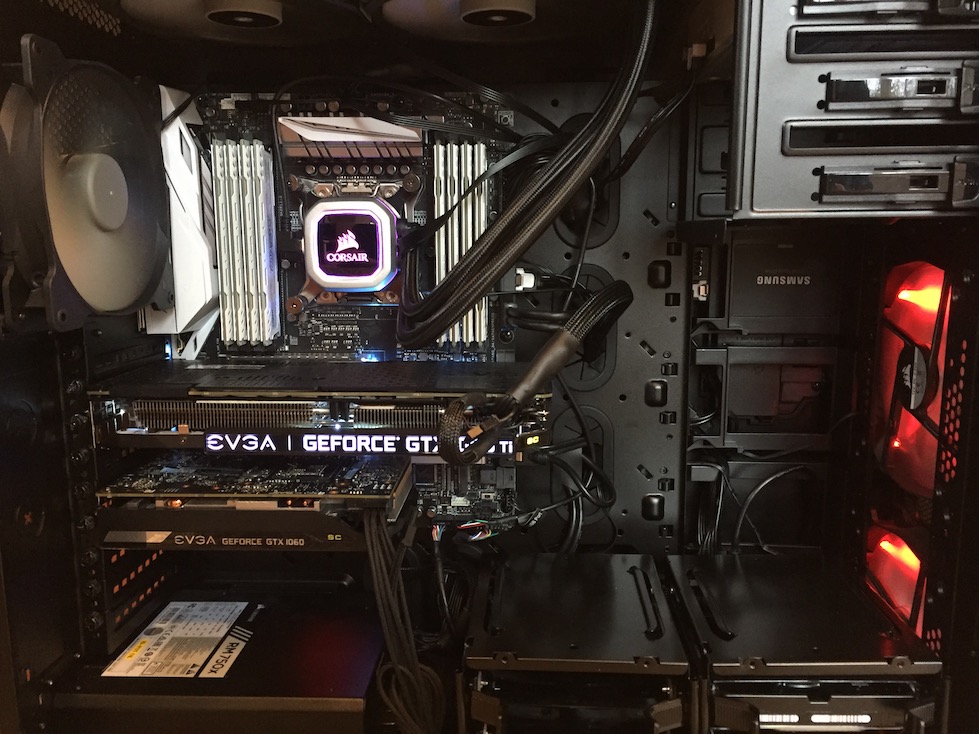
Update, 3/14/2018: While I’ve still maintained the same basic workstation, I have done some upgrades. Before GPU prices skyrocketed, I added a 1080ti to workstation along with the 1060. However, this required an upgrade of my case to fit both. I ended up getting a Corsair 760T, which is an enormous increase in space over the Corsair mid-tower I had before.
Since I was already in the case, I also added a AIO water-cooler to my CPU, a Corsair H115i Pro. While this wasn’t strictly necessary (I wasn’t having overheating issues with a single GPU and overclocked CPU), with two GPUs I figured that it was a good precaution. The water-cooler is also much quieter than my original air-cooled heatsink, which is nice.
So now I have a huge amount of open space, which is great for airflow, a dual-GPU rig and depending on how you calculate things, I’m at around $3000 for a workstation that should serve me well into the next several years (hopefully more!)
(original post below)
i need some kind of super computer to parse a multi-gigabyte XML file, @randyzwitch
For all the downsides of social media these days, the people I’ve met and the inside jokes bring me immense joy. From just this one tweet, several people messaged me aghast at 1) the idea of multi-gigabyte XML and that 2) I apparently have a computer for just this purpose!
Recently, I did build a workstation as a test bed for learning more about data science, specifically in the areas of Docker and GPU computing. Here’s what I built.
Machine Specs and Assembling from Parts
While there are several specialist workstation companies like Titan Computing that sell configurable workstations, assembling a computer from parts is pretty easy, and more importantly, can be significantly cheaper if you choose ‘consumer-grade’ parts instead of ‘server-grade’. Because I’m not planning on curing cancer or building Skynet with this computer, I opted not to get a dual-chip motherboard and used a single Intel i7 chip rather than going with Xeon workstation class chip(s). I also chose to use standard DDR4 RAM rather than ECC RAM. Here’s the full spec list:
Cooler Master Hyper 212 EVO 82.9 CFM Sleeve Bearing CPU Cooler
Motherboard
Asus X99-A II ATX LGA2011-3 Motherboard
Memory
Crucial Ballistix Sport LT 32GB (2 x 16GB) DDR4-2400 Memory
Memory
Crucial Ballistix Sport LT 32GB (2 x 16GB) DDR4-2400 Memory
Memory
Crucial Ballistix Sport LT 32GB (2 x 16GB) DDR4-2400 Memory
Memory
Crucial Ballistix Sport LT 32GB (2 x 16GB) DDR4-2400 Memory
Storage
Samsung 850 EVO-Series 250GB 2.5” Solid State Drive
Storage
Hitachi Deskstar 1TB 3.5” 7200RPM Internal Hard Drive
Video Card
EVGA GeForce GTX 1060 6GB 6GB SC GAMING Video Card
Case
Corsair SPEC-02 ATX Mid Tower Case
Power Supply
Corsair CXM 750W 80+ Bronze Certified Semi-Modular ATX Power Supply
Optical Drive
Asus DRW-24B1ST/BLK/B/AS DVD/CD Writer
Total: ~$2000
So for about $2000 and a few hours of time assembling, I have the rough equivalent of an r3.4xlarge instance on AWS ($1.33/hr on-demand at the time of writing). It would take about 1500 hours of usage to breakeven vs. using AWS, but cost isn’t really the point; the convenience of having the computer in my house and not having to do the startup/shutdown/EC2 images/S3/firewall/etc. dance is more than worth it to me so that I can focus on learning instead of operations.
Ubuntu 16.04LTS, CUDA, and Other Installs
While I did use Windows 10 to validate I put together my hardware correctly (and to mess with overlocking settings using the ASUS motherboard tools), I decided to use Ubuntu 16.04LTS as my base operating system. This allows for the most ‘server-like’ operations that I’m used to from a Linux environment. I enabled an internal static IP through my router, and for the most part, I either SSH into the machine from my MacBook Pro or use web UIs such as Jupyter Notebook (and again, remotely from my laptop).
I tried to install the NVIDIA drivers from source for the GTX1060 GPU, but eventually gave up and went the apt package manager route and everything works fine. Though I rarely sit at my desktop, I do have a 4K monitor hooked up to this computer which looks gorgeous with a video card of this caliber, and I have CUDA installed and working as well.
From there, I installed any number of tools from Python, R, Julia, MonetDB, Docker, Neo4j, Postgres, Spark, BlazingDB…any/all of which I hope to write about more in the near future.