Grammar-of-graphics charts,
native to Mojo
One fluent Plot builder – mark, encode, theme – covers 40+ chart types,
rendered to SVG or raster.
See it before you build it
Every chart below comes straight from the example gallery.
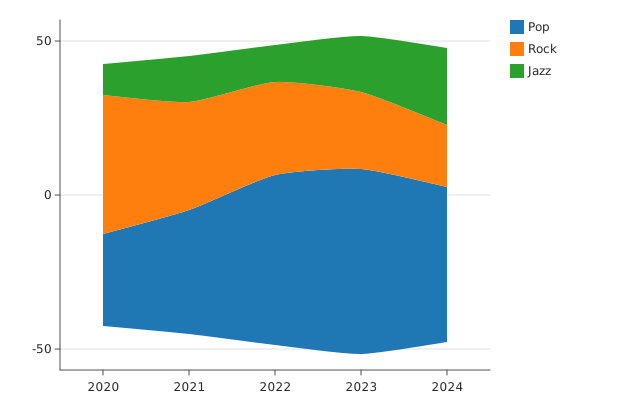
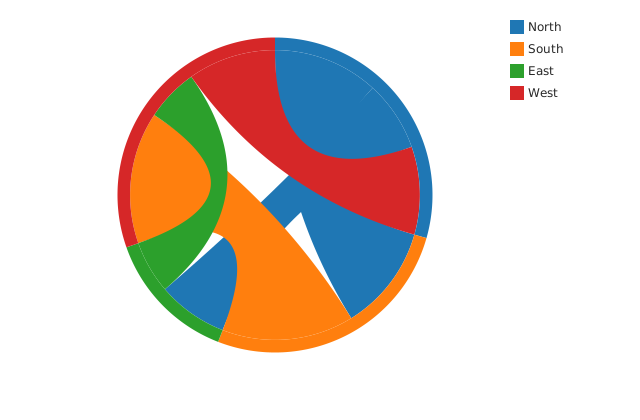
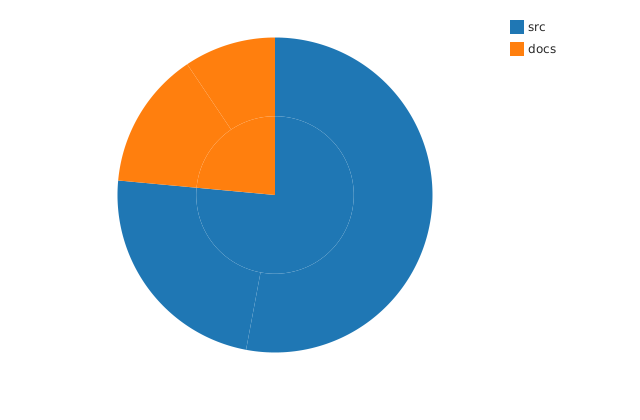
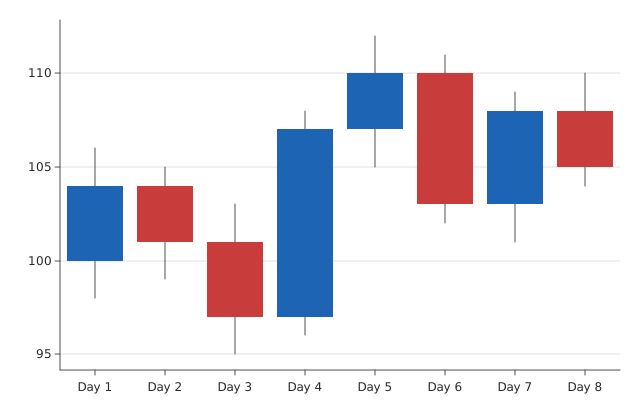
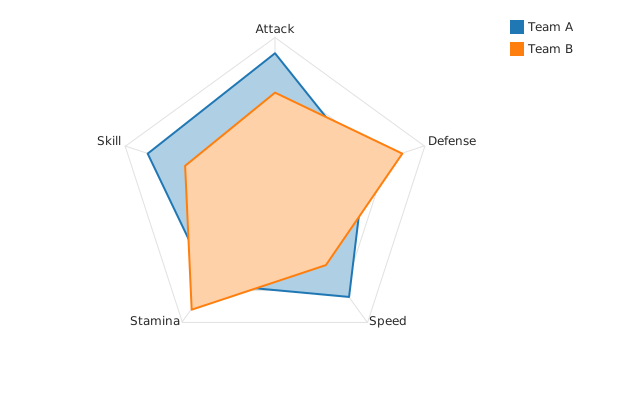
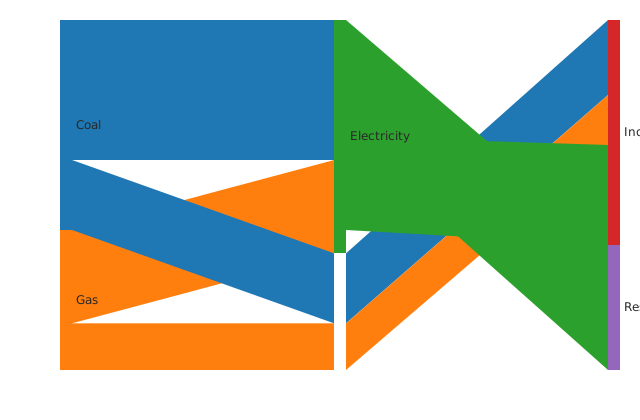
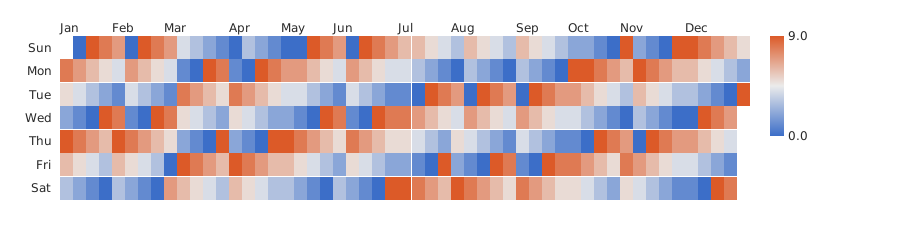
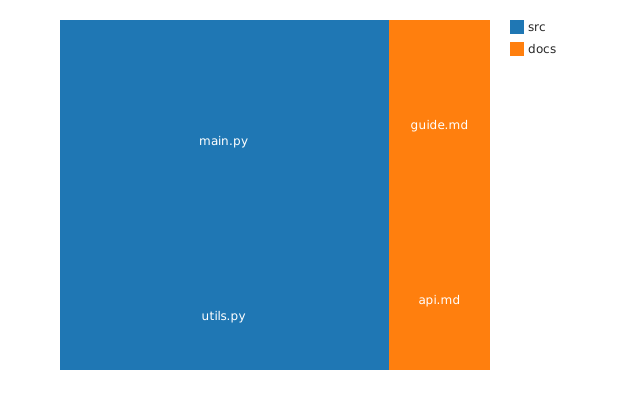
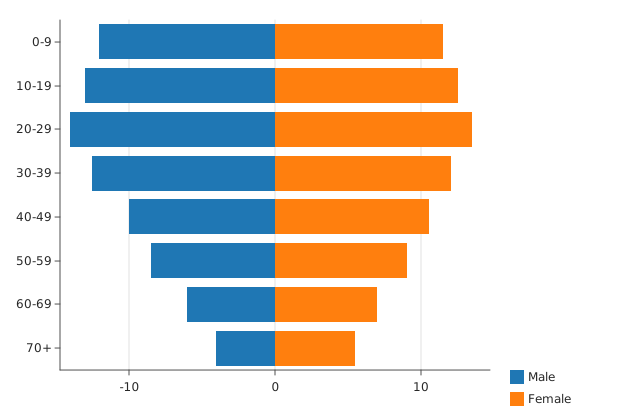
Nine of the 40+ chart types this package builds -- see the rest, source next to rendered output, in the examples gallery.
Why dataviz_mojo?
Grammar of graphics when you want it
One fluent Plot builder – mark_point()/mark_bar()/… + encode() + .theme() is enough to build any chart.
40+ convenience chart functions
Scatter and bar through sankey, treemap, radar, and candlestick – statistical, financial, hierarchical, radial, and network charts all share the same API.
Native Mojo, no bindings
Pure Mojo top to bottom, built on canvas_mojo!
SVG or raster
Every Plot renders to crisp SVG or a PNG/BMP raster canvas – save() picks the backend from the file extension.
One pixi install away
A git-source pixi dependency – pixi install builds dataviz_mojo and canvas_mojo for you
Open Source
MIT licensed on GitHub – read the source, file an issue, or send a PR.
A first chart
from dataviz_mojo import Plot, save

def main() raises:
    var x: List[Float64] = [1.0, 2.0, 3.0, 4.0, 5.0, 6.0, 7.0, 8.0, 9.0, 10.0]
    var y: List[Float64] = [2.3, 4.1, 3.6, 5.8, 5.1, 7.4, 6.9, 8.2, 9.0, 8.6]

    var plot = (
                Plot()
                .mark_point()
                .encode(x=x, y=y)
               )

    save(plot, "chart.svg")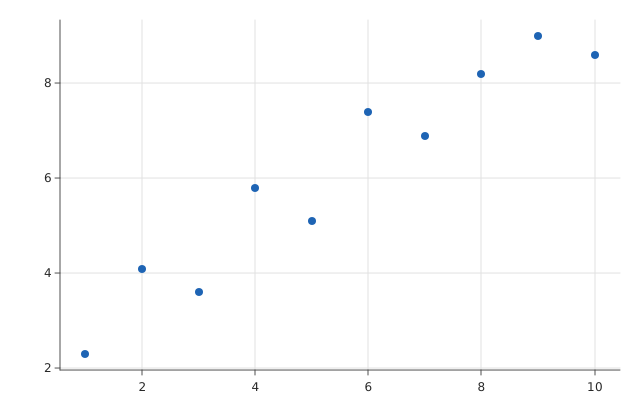
That’s the same pattern behind every mark type this package supports, plus color/size encoding, facets, multi-series layering, and the raster backend.