Reference Line
Reference Line
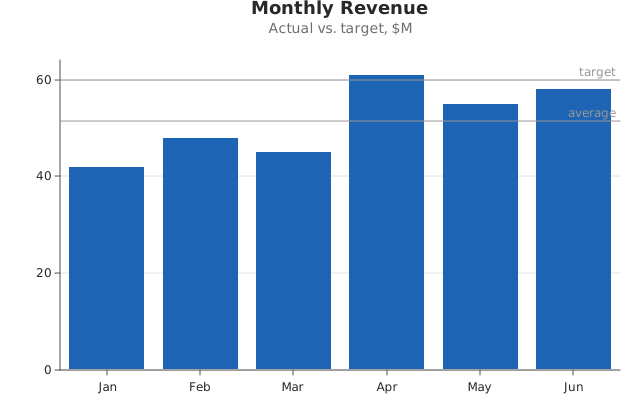
Add a horizontal reference line at value on the y-axis.
Usage
from dataviz_mojo.plot import Plot, save

def main() raises:
    var months: List[String] = ["Jan", "Feb", "Mar", "Apr", "May", "Jun"]
    var revenue: List[Float64] = [42.0, 48.0, 45.0, 61.0, 55.0, 58.0]

    var plot = Plot().mark_bar().encode_categorical(x=months, y=revenue).labels(
        title="Monthly Revenue", subtitle="Actual vs. target, $M"
    ).annotate_line(60.0, label="target").annotate_line(51.5, label="average")
    save(plot, "docs/src/examples/out_annotate_line.svg")
Args:
value: The y-value to draw the line at. Outside the mark’s (padded) y-domain, draws nothing.label: Drawn to the right of the line when non-empty; left empty (the default), the line draws with no label.