Point Marker
Point Marker
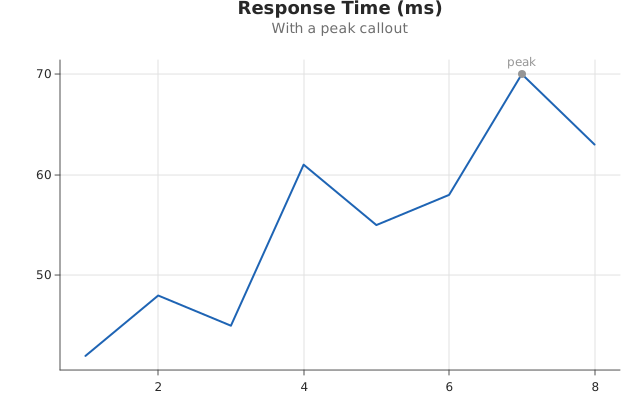
Add a single labeled point at (x, y).
Usage
from dataviz_mojo.plot import Plot, save

def main() raises:
    var x: List[Float64] = [1.0, 2.0, 3.0, 4.0, 5.0, 6.0, 7.0, 8.0]
    var latency: List[Float64] = [42.0, 48.0, 45.0, 61.0, 55.0, 58.0, 70.0, 63.0]

    var plot = (
        Plot()
        .mark_line()
        .encode(x=x, y=latency)
        .labels(title="Response Time (ms)", subtitle="With a peak callout")
        .annotate_point(7.0, 70.0, label="peak")
    )
    save(plot, "docs/src/examples/out_annotate_point.svg")
Args:
x: The point’s x-coordinate. Outside the mark’s (padded) x-domain, draws nothing.y: The point’s y-coordinate. Outside the mark’s (padded) y-domain, draws nothing.label: Drawn just above the point when non-empty; left empty (the default), the point draws with no label.