Drawing a Canvas Scaled & Rotated
Drawing a Canvas Scaled & Rotated
Place a scaled and rotated canvas through a matrix.
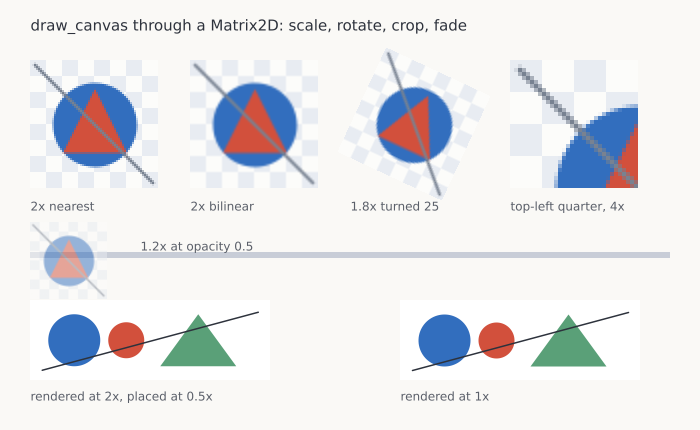
Usage
from std.math import pi

from canvas.buffer import Canvas
from canvas.color import Color
from canvas.compose import Filter, draw_canvas
from canvas.geometry import Matrix2D
from canvas.io.png import write_png
from canvas.path import Path, fill_path_aa
from canvas.shapes.circles import fill_circle_aa
from canvas.shapes.lines import draw_line_aa
from canvas.shapes.rects import fill_rect
from canvas.text.font_cache import FontCache
from canvas.text.render import draw_text

comptime W = 700
comptime H = 430
comptime SHEET = Color(250, 249, 246)
comptime INK = Color(45, 50, 60)
comptime LABEL = Color(90, 95, 105)
comptime BLUE = Color(50, 110, 190)
comptime RED = Color(210, 80, 60)
comptime PALE = Color(232, 236, 242)


def _tile() raises -> Canvas:
    """The 64x64 source: a checker for the filters to disagree about,
    and a disk and a triangle for edges that were anti-aliased before
    they were resampled.
    """
    var t = Canvas(64, 64, Color(252, 252, 250))
    for row in range(8):
        for col in range(8):
            if (row + col) % 2 == 0:
                fill_rect(t, col * 8, row * 8, 8, 8, PALE)
    fill_circle_aa(t, 32.0, 32.0, 21.0, BLUE)
    var tri = Path()
    tri.move_to(32.0, 14.0)
    tri.line_to(48.0, 46.0)
    tri.line_to(16.0, 46.0)
    tri.close()
    fill_path_aa(t, tri, RED)
    draw_line_aa(t, 2.0, 2.0, 61.0, 61.0, Color(120, 130, 145), 1.5)
    return t^


def _figure(mut c: Canvas, x: Float64, y: Float64, scale: Float64) raises:
    """A small figure drawn at `scale` with its top-left at (x, y):
    what the bottom row renders once at 2x and once at 1x.
    """
    fill_rect(
        c,
        Int(x),
        Int(y),
        Int(240.0 * scale),
        Int(80.0 * scale),
        Color(255, 255, 255),
    )
    fill_circle_aa(c, x + 44.0 * scale, y + 40.0 * scale, 26.0 * scale, BLUE)
    fill_circle_aa(c, x + 96.0 * scale, y + 40.0 * scale, 18.0 * scale, RED)
    var wedge = Path()
    wedge.move_to(x + 130.0 * scale, y + 66.0 * scale)
    wedge.line_to(x + 168.0 * scale, y + 14.0 * scale)
    wedge.line_to(x + 206.0 * scale, y + 66.0 * scale)
    wedge.close()
    fill_path_aa(c, wedge, Color(90, 160, 120))
    draw_line_aa(
        c,
        x + 12.0 * scale,
        y + 70.0 * scale,
        x + 228.0 * scale,
        y + 12.0 * scale,
        INK,
        1.5 * scale,
    )


def main() raises:
    var cache = FontCache()
    var sheet = Canvas(W, H, SHEET)
    var tile = _tile()

    draw_text(
        sheet,
        30.0,
        30.0,
        "draw_canvas through a Matrix2D: scale, rotate, crop, fade",
        INK,
        size=15.0,
        cache=cache,
    )

    # Doubled two ways. The matrix maps the tile's texel space, where
    # pixel (i, j) covers [i, i+1) x [j, j+1), so a factor of two puts
    # each source pixel on exactly four destination pixels and the
    # nearest-neighbor panel is the tile with no new colors in it.
    draw_canvas(
        sheet,
        tile,
        Matrix2D.scaling(2.0, 2.0).then(Matrix2D.translation(30.0, 60.0)),
        filter=Filter.NEAREST,
    )
    draw_canvas(
        sheet,
        tile,
        Matrix2D.scaling(2.0, 2.0).then(Matrix2D.translation(190.0, 60.0)),
        filter=Filter.BILINEAR,
    )

    # A quarter of a turn's worth of rotation about the tile's own
    # center: move the center to the origin, scale and turn there, and
    # put it where the panel is.
    var turned = (
        Matrix2D.translation(-32.0, -32.0)
        .then(Matrix2D.scaling(1.8, 1.8))
        .then(Matrix2D.rotation(25.0 * pi / 180.0))
        .then(Matrix2D.translation(414.0, 124.0))
    )
    draw_canvas(sheet, tile, turned)

    # The top-left quadrant at 4x. The crop picks the source pixels and
    # the matrix picks where they land, so the two are independent.
    draw_canvas(
        sheet,
        tile,
        0,
        0,
        32,
        32,
        Matrix2D.scaling(4.0, 4.0).then(Matrix2D.translation(510.0, 60.0)),
        filter=Filter.NEAREST,
    )

    for name_and_x in [
        ("2x nearest", 30.0),
        ("2x bilinear", 190.0),
        ("1.8x turned 25", 350.0),
        ("top-left quarter, 4x", 510.0),
    ]:
        draw_text(
            sheet,
            name_and_x[1],
            210.0,
            name_and_x[0],
            LABEL,
            size=12.0,
            cache=cache,
        )

    # Half opacity over a rule, to show the fade applying to a mapped
    # draw as it does to a blit.
    fill_rect(sheet, 30, 252, 640, 6, Color(200, 205, 215))
    draw_canvas(
        sheet,
        tile,
        Matrix2D.scaling(1.2, 1.2).then(Matrix2D.translation(30.0, 222.0)),
        0.5,
    )
    draw_text(
        sheet,
        140.0,
        250.0,
        "1.2x at opacity 0.5",
        LABEL,
        size=12.0,
        cache=cache,
    )

    # Supersampling: the figure rendered at 2x into its own canvas and
    # placed at 0.5x, beside the same figure rendered at 1x.
    var big = Canvas(480, 160, Color(255, 255, 255))
    _figure(big, 0.0, 0.0, 2.0)
    draw_canvas(
        sheet,
        big,
        Matrix2D.scaling(0.5, 0.5).then(Matrix2D.translation(30.0, 300.0)),
        filter=Filter.BILINEAR,
    )
    _figure(sheet, 400.0, 300.0, 1.0)

    draw_text(
        sheet,
        30.0,
        400.0,
        "rendered at 2x, placed at 0.5x",
        LABEL,
        size=12.0,
        cache=cache,
    )
    draw_text(
        sheet, 400.0, 400.0, "rendered at 1x", LABEL, size=12.0, cache=cache
    )

    write_png(sheet, "examples/out_draw_image.png")
    print("wrote examples/out_draw_image.png")