Layers & Compositing
Layers & Compositing
Compose independently rendered canvases into one image.
Usage
from std.math import sin

from canvas.buffer import Canvas
from canvas.color import Color
from canvas.compose import draw_canvas
from canvas.geometry import FPoint
from canvas.io.png import write_png
from canvas.shapes.circles import fill_circle_aa
from canvas.shapes.lines import draw_line_aa, draw_polyline_aa
from canvas.shapes.rects import fill_rect
from canvas.text.font_cache import FontCache
from canvas.text.render import draw_text

comptime W = 560
comptime H = 300
comptime CLEAR = Color(0, 0, 0, 0)
comptime PLOT_L = 60
comptime PLOT_R = 520
comptime PLOT_T = 40
comptime PLOT_B = 240


def _series_y(i: Int) -> Float64:
    return 140.0 - 70.0 * sin(Float64(i) * 0.12)


def main() raises:
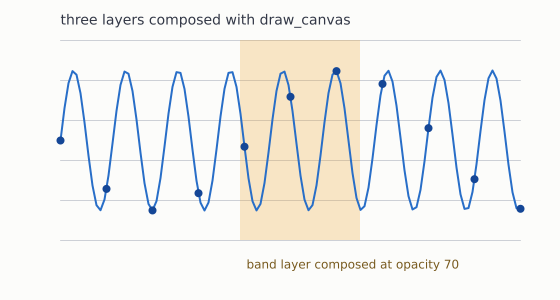
    # Layer 1: the grid. Transparent everywhere except the rules
    # themselves, so the sheet color shows between them.
    var grid = Canvas(W, H, CLEAR)
    for step in range(6):
        var gy = PLOT_T + step * 40
        draw_line_aa(
            grid,
            Float64(PLOT_L),
            Float64(gy),
            Float64(PLOT_R),
            Float64(gy),
            Color(120, 130, 150, 90),
        )

    # Layer 2: the series.
    var series = Canvas(W, H, CLEAR)
    var points = List[FPoint]()
    for i in range(0, 461, 4):
        points.append(FPoint(Float64(PLOT_L + i) * 1.0, _series_y(i)))
    draw_polyline_aa(series, points, Color(40, 110, 200), width=2.0)
    for i in range(0, 461, 46):
        fill_circle_aa(
            series, Float64(PLOT_L + i), _series_y(i), 4.0, Color(20, 70, 150)
        )

    # Layer 3: an annotation band, fully opaque on its own canvas. It
    # becomes translucent only because of the opacity it is composed
    # at -- drawing it opaque here keeps the layer reusable at any
    # strength.
    var band = Canvas(W, H, CLEAR)
    fill_rect(band, 240, PLOT_T, 120, PLOT_B - PLOT_T, Color(240, 170, 60))

    # Compose, bottom to top, onto an opaque sheet.
    var sheet = Canvas(W, H, Color(252, 252, 250))
    draw_canvas(sheet, grid, 0, 0)
    draw_canvas(sheet, band, 0, 0, 70)  # faded at composite time
    draw_canvas(sheet, series, 0, 0)

    var cache = FontCache()
    draw_text(
        sheet,
        Float64(PLOT_L),
        24.0,
        "three layers composed with draw_canvas",
        Color(50, 55, 70),
        size=14.0,
        cache=cache,
    )
    draw_text(
        sheet,
        246.0,
        268.0,
        "band layer composed at opacity 70",
        Color(120, 90, 30),
        size=12.0,
        cache=cache,
    )

    write_png(sheet, "examples/out_layers.png")