Bullet
Bullet
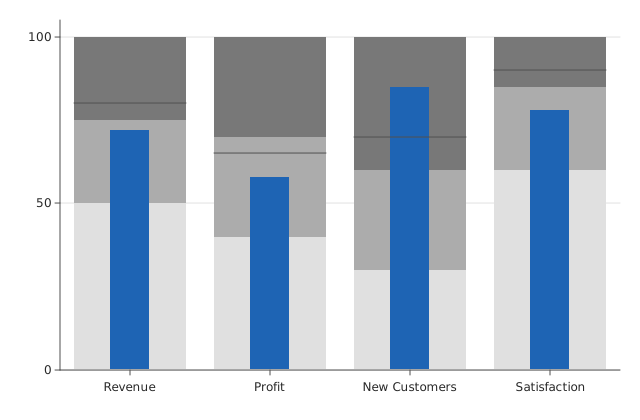
A bullet chart.
Usage
from dataviz_mojo import bullet
from dataviz_mojo.plot import save
from dataviz_mojo.theme import Theme

def main() raises:
    var kpis: List[String] = ["Revenue", "Profit", "New Customers", "Satisfaction"]
    var measures: List[Float64] = [72.0, 58.0, 85.0, 78.0]
    var targets: List[Float64] = [80.0, 65.0, 70.0, 90.0]
    var ranges: List[List[Float64]] = [
        [50.0, 75.0, 100.0],
        [40.0, 70.0, 100.0],
        [30.0, 60.0, 100.0],
        [60.0, 85.0, 100.0],
    ]

    var c = bullet(kpis, measures, targets, ranges)
    save(c, "docs/src/examples/out_bullet.svg")
Args:
categories: One row per entry, in the given order.measures: Each category’s actual value, drawn as the narrow measure bar.targets: Each category’s goal value, drawn as a tick mark across the full band width.ranges: Each category’s own list of ascending qualitative- range thresholds (poor/satisfactory/good, …), drawn as shaded background bands from lightest to darkest.theme: Full styling knobs beyond this function’s own parameters (colors, margins, fonts, gridlines, …) – seeTheme’s docstring.width: Pixel width of the returnedPlot(.size()).height: Pixel height of the returnedPlot(.size()).title: The chart’s title, shown above the plot.subtitle: A secondary line shown under the title.x_title: The x-axis caption.y_title: The y-axis caption.