Nightingale Rose
Nightingale Rose
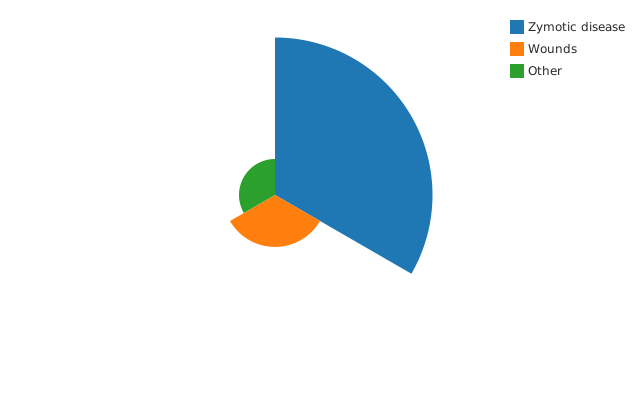
A rose/coxcomb chart.
Usage
from dataviz_mojo import nightingale
from dataviz_mojo.plot import save

def main() raises:
    var causes: List[String] = ["Zymotic disease", "Wounds", "Other"]
    var deaths: List[Float64] = [1857.0, 202.0, 97.0]

    var c = nightingale(causes, deaths, area=True)
    save(c, "docs/src/examples/out_nightingale.svg")
Args:
categories: One wedge per entry, in the given order.values: Each wedge’s value; every value must be non-negative, and at least one positive.area:False(the default) scales each wedge’s radius byvalue;Truescales its area instead (ECharts'rose_type="area").theme: Full styling knobs beyond this function’s own parameters (colors, margins, fonts, gridlines, …) – seeTheme’s docstring.width: Pixel width of the returnedPlot(.size()).height: Pixel height of the returnedPlot(.size()).title: The chart’s title, shown above the plot.subtitle: A secondary line shown under the title.x_title: The x-axis caption.y_title: The y-axis caption.