Polar (Multi-Series)
Polar (Multi-Series)
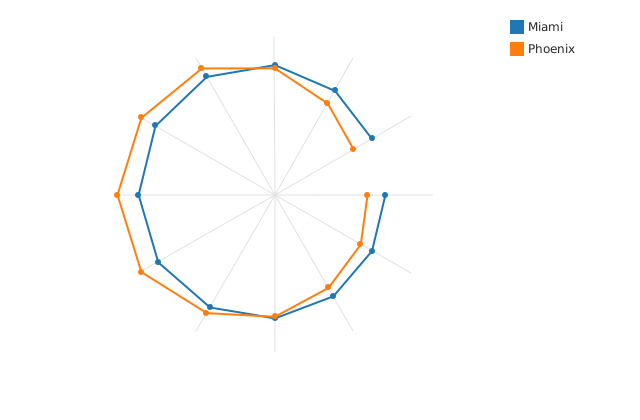
A multi-series polar-coordinate line plot.
Usage
from std.math import pi

from dataviz_mojo import polar_series
from dataviz_mojo.plot import save

def main() raises:
    var angle = List[Float64]()
    for i in range(12):
        angle.append(2.0 * pi * Float64(i) / 12.0)

    var names: List[String] = ["Miami", "Phoenix"]
    var miami: List[Float64] = [68.0, 69.0, 72.0, 76.0, 80.0, 83.0, 84.0, 85.0, 84.0, 80.0, 74.0, 69.0]
    var phoenix: List[Float64] = [57.0, 61.0, 66.0, 75.0, 84.0, 95.0, 97.0, 95.0, 90.0, 78.0, 65.0, 56.0]
    var values: List[List[Float64]] = [miami.copy(), phoenix.copy()]

    var c = polar_series(angle, names, values)
    save(c, "docs/src/examples/out_polar_series.svg")
Args:
angle: Radians, used exactly as given and unwrapped – shared by every series.series_names: One trace per name, used as the legend key.series_values:series_values[j]isseries_names[j]’s radius per angle; every value must be non-negative, and every series shares one radius scale (max(radius)computed across all of them together).theme: Full styling knobs beyond this function’s own parameters (colors, margins, fonts, gridlines, …) – seeTheme’s docstring.width: Pixel width of the returnedPlot(.size()).height: Pixel height of the returnedPlot(.size()).title: The chart’s title, shown above the plot.subtitle: A secondary line shown under the title.x_title: The x-axis caption.y_title: The y-axis caption.