Pie/Donut
Pie/Donut
A pie chart.
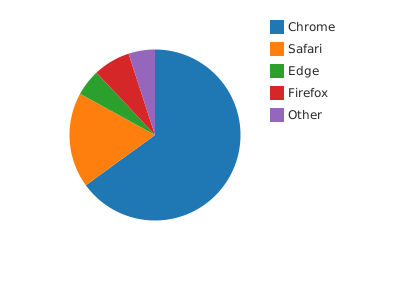
Usage
from dataviz_mojo import pie
from dataviz_mojo.plot import save

def main() raises:
    var browsers: List[String] = ["Chrome", "Safari", "Edge", "Firefox", "Other"]
    var share: List[Float64] = [65.0, 18.0, 5.0, 7.0, 5.0]

    var c = pie(browsers, share, width=400, height=300)
    save(c, "docs/src/examples/out_pie.svg")
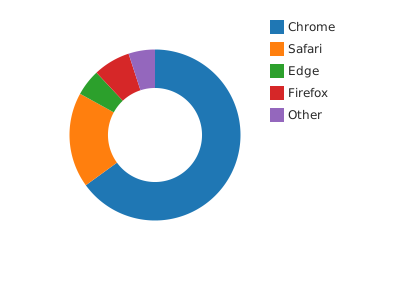
Donut (donut_inner_radius_fraction)
from dataviz_mojo import pie
from dataviz_mojo.plot import save
from dataviz_mojo.theme import Theme

def main() raises:
    var browsers: List[String] = ["Chrome", "Safari", "Edge", "Firefox", "Other"]
    var share: List[Float64] = [65.0, 18.0, 5.0, 7.0, 5.0]

    var c_donut = pie(
        browsers,
        share,
        theme=Theme(donut_inner_radius_fraction=0.55),
        width=400,
        height=300,
    )
    save(c_donut, "docs/src/examples/out_pie_donut.svg")
Args:
categories: One wedge per entry, in the given order.values: Each category’s share; every value must be non-negative, and at least one positive.theme: Full styling knobs beyond this function’s own parameters, includingdonut_inner_radius_fractionfor a donut – seeTheme’s docstring.width: Pixel width of the returnedPlot(.size()).height: Pixel height of the returnedPlot(.size()).title: The chart’s title, shown above the plot.subtitle: A secondary line shown under the title.x_title: Unused – a pie chart has no x-axis to label.y_title: Unused – a pie chart has no y-axis to label.