Polar
Polar
A polar-coordinate line plot.
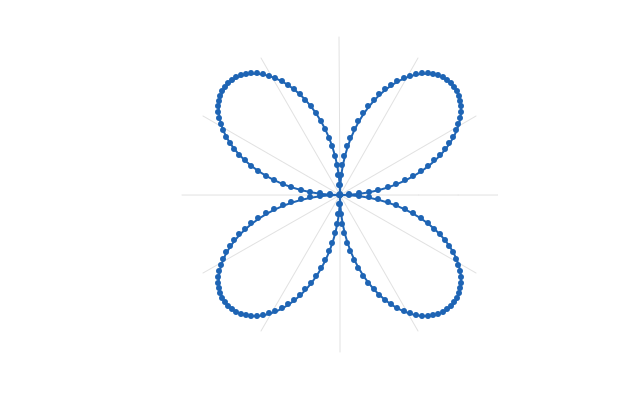
Usage
from std.math import pi, sin

from dataviz_mojo import polar
from dataviz_mojo.plot import save

def main() raises:
    var angle = List[Float64]()
    var radius = List[Float64]()
    var steps = 200
    for i in range(steps + 1):
        var theta = 2.0 * pi * Float64(i) / Float64(steps)
        var r = sin(2.0 * theta)
        # A negative r has no polar meaning on its own -- fold it into
        # the opposite direction (theta + pi) instead, the standard
        # way a signed polar radius is plotted, so the curve's negative lobes still draw rather than getting clipped by
        # encode_polar()'s non-negative-radius validation.
        if r < 0.0:
            angle.append(theta + pi)
            radius.append(-r)
        else:
            angle.append(theta)
            radius.append(r)

    var c = polar(angle, radius)
    save(c, "docs/src/examples/out_polar.svg")
Args:
angle: Radians, used exactly as given and unwrapped – values beyond2*pispiral outward rather than overlapping.radius: Linearly scaled from[0, max(radius)], always zero-anchored at the chart’s center; every value must be non-negative.theme: Full styling knobs beyond this function’s own parameters (colors, margins, fonts, gridlines, …) – seeTheme’s docstring.width: Pixel width of the returnedPlot(.size()).height: Pixel height of the returnedPlot(.size()).title: The chart’s title, shown above the plot.subtitle: A secondary line shown under the title.x_title: The x-axis caption.y_title: The y-axis caption.