Punchcard
Punchcard
A punchcard.
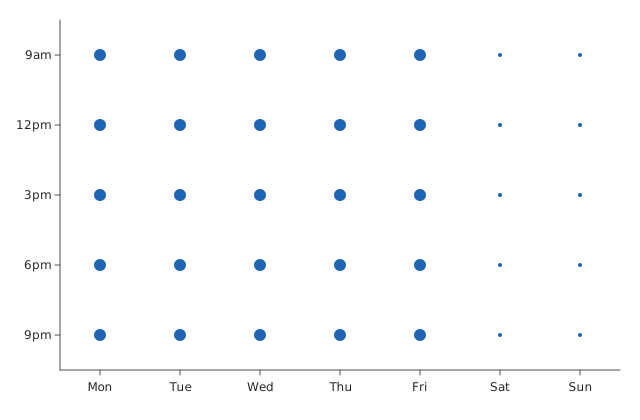
Usage
from dataviz_mojo import punchcard
from dataviz_mojo.plot import save

def main() raises:
    var days: List[String] = ["Mon", "Tue", "Wed", "Thu", "Fri", "Sat", "Sun"]
    var hours: List[String] = ["9am", "12pm", "3pm", "6pm", "9pm"]

    var x = List[String]()
    var y = List[String]()
    var counts = List[Float64]()
    for day_i in range(len(days)):
        var is_weekend = day_i >= 5
        for hour in hours:
            x.append(days[day_i])
            y.append(hour)
            counts.append(15.0 if is_weekend else 60.0)

    var c = punchcard(x, y, counts)
    save(c, "docs/src/examples/out_punchcard.svg")
Args:
x: Each bubble’s column category, one entry per row of data.y: Each bubble’s row category, one entry per row of data.sizes: Each bubble’s raw size value, divided byscalebefore drawing.scale: Dividessizesbefore drawing – raise it to shrink bubbles that would otherwise overlap.theme: Full styling knobs beyond this function’s own parameters (colors, margins, fonts, gridlines, …) – seeTheme’s docstring.width: Pixel width of the returnedPlot(.size()).height: Pixel height of the returnedPlot(.size()).title: The chart’s title, shown above the plot.subtitle: A secondary line shown under the title.x_title: The x-axis caption.y_title: The y-axis caption.