Correlation Plot
Correlation Plot
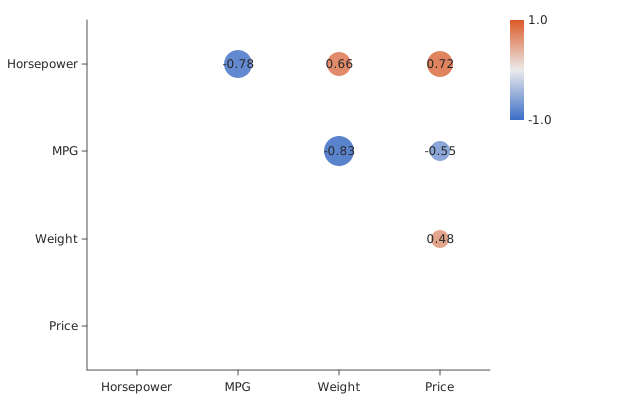
A correlation plot.
Usage
from dataviz_mojo import corrplot
from dataviz_mojo.plot import save

def main() raises:
    var variables: List[String] = ["Horsepower", "MPG", "Weight", "Price"]
    var matrix: List[List[Float64]] = [
        [1.0, -0.78, 0.66, 0.72],
        [-0.78, 1.0, -0.83, -0.55],
        [0.66, -0.83, 1.0, 0.48],
        [0.72, -0.55, 0.48, 1.0],
    ]

    var c = corrplot(variables, matrix, layout="upper", diag=False)
    save(c, "docs/src/examples/out_corrplot.svg")
Args:
variables: One row and one column per entry –matrixmust be this length square.matrix: The square pairwise-correlation matrix, each value in[-1.0, 1.0].layout: Which triangle ofmatrixto draw –"full"(the default),"lower", or"upper".diag: Whether to draw the diagonal cells (variables[i]against itself); defaults toTrue.labels: Whether to drawvariables’ names along the axes; defaults toTrue.theme: Full styling knobs beyond this function’s own parameters (colors, margins, fonts, gridlines, …) – seeTheme’s docstring.width: Pixel width of the returnedPlot(.size()).height: Pixel height of the returnedPlot(.size()).title: The chart’s title, shown above the plot.subtitle: A secondary line shown under the title.x_title: The x-axis caption.y_title: The y-axis caption.