Histogram
Histogram
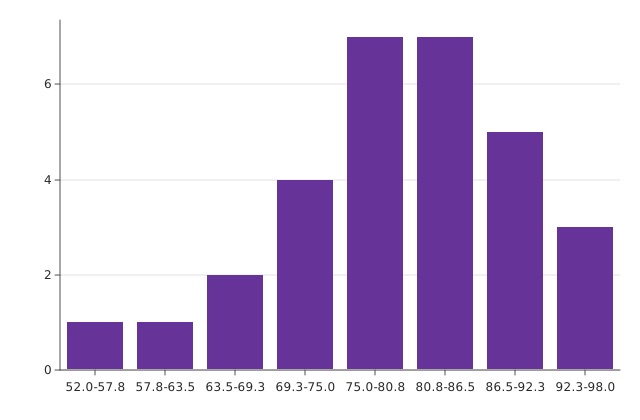
A histogram.
Usage
from dataviz_mojo import histogram
from dataviz_mojo.plot import save
from dataviz_mojo.colors import REBECCAPURPLE
from dataviz_mojo.theme import Theme

def main() raises:
    # Exam scores out of 100 -- a real bell-ish spread, not a uniform
    # or already-sorted list, so the binning has genuine work to do.
    var scores: List[Float64] = [
        52.0, 61.0, 65.0, 68.0, 70.0, 71.0, 72.0, 74.0, 75.0, 76.0,
        77.0, 78.0, 78.0, 79.0, 80.0, 81.0, 81.0, 82.0, 83.0, 84.0,
        85.0, 86.0, 87.0, 88.0, 89.0, 90.0, 91.0, 93.0, 95.0, 98.0,
    ]

    var c = histogram(scores, bins=8, theme=Theme(mark_color=REBECCAPURPLE))
    save(c, "docs/src/examples/out_histogram.svg")
Args:
data: The raw values to bin – not pre-counted; binning happens internally.bins: How many equal-width intervals to dividedata’s range into (half-open except the last, which includes its upper edge).theme: Full styling knobs beyond this function’s own parameters (colors, margins, fonts, gridlines, …) – seeTheme’s docstring.width: Pixel width of the returnedPlot(.size()).height: Pixel height of the returnedPlot(.size()).title: The chart’s title, shown above the plot.subtitle: A secondary line shown under the title.x_title: The x-axis caption.y_title: The y-axis caption.