A few months back, Justin Cutroni posted on his blog some jQuery code that modifies how Google Analytics tracks content. Specifically, the code snippet changes how bounce rate and time on site are calculated, creates a custom variable to classify whether visitors are “Readers” vs. “Scanners” and adds some Google Analytics events to track how far down the page visitors are reading.
Given that this blog is fairly technical and specific in nature, I was interested in seeing how the standard Google Analytics metrics would change if I implemented this code and how my changes compared to Justin’s. I’ve always suspected my bounce rate in the 80-90% range didn’t really represent whether people were finding value in my content. The results were quite surprising to say the least!
Bounce Rate - Dropped through the floor!
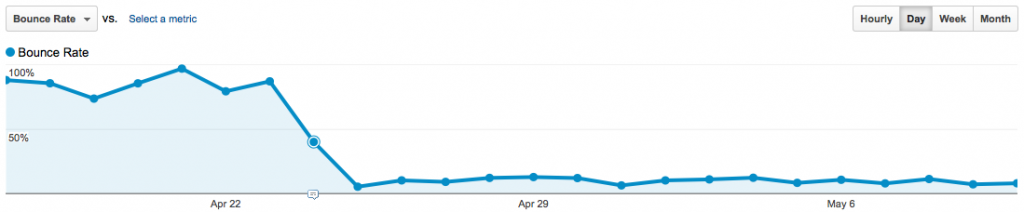
Starting April 24th, Bounce Rate drops considerably!
As expected, implementing the content tracking code caused a significant drop in bounce rate, due to counting scrolling as a page “interaction” using Google Analytics events. Thus, the definition of bounce rate changed from single page view visits to visitors that don’t interact with the page by scrolling at least 150 pixels.
In the case of my blog, the bounce rate dropped from 80-90% to 5-15%! This result tells me that people who arrive on-site aren’t arriving by accident, that they are specifically interested in the content. Sure, I could’ve validated this using incoming search term research, but this provides a second data point. The content I provide not only ranks well in Google, but once on-site also causes readers to want to see what the article contains.
Readers vs. Scanners
Even with the bounce rate drop above, I really don’t get a good feeling about whether people are actually reading the content. Sure, people are scrolling 150px or more, but due to the ADHD nature of the web, plenty of people scroll without reading just to see what else is on the page! That’s where the “Readers vs. Scanners” report comes in:
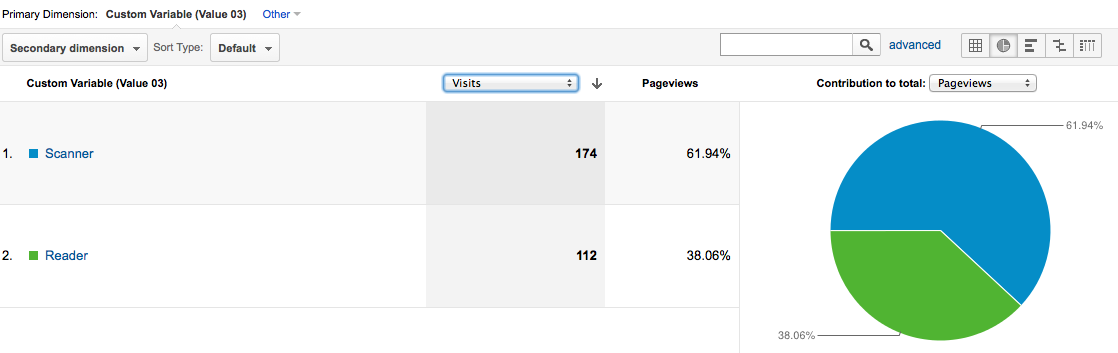
62% of visits only scan instead of read - Need to do better here!
The report above shows that only 38% of visits to the site actually READ an article, rather than just quickly scroll. This is disappointing, but now that I’ve got the information being tracked, I can set up a goal in Google Analytics with the aim of improving the ratio of actual readers vs. quick scrollers.
Average Visit Duration - Still useless
Like the bounce rate definition change above, average visit duration and average time on page also change definitions when using the jQuery content tracking code. Given that Google Analytics calculates time metrics by measuring the time between page views or events, by adding more events on the page, all time on site metrics have to increase (by definition).
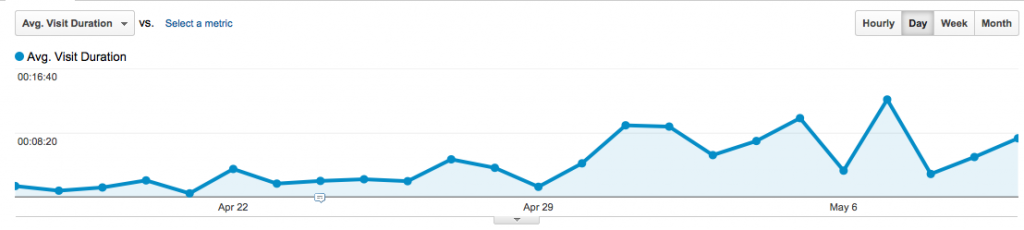
Hard to see because of the Y-axis, but Avg. Visit Duration increases significantly as well.
That said, average visit duration is still a pretty useless metric, given that an increase/decrease in this metric doesn’t immediately tell you “good” or “bad”…
Content Consumption “Funnel”
Finally, the last change that occurs when you implement the content tracking code is a series of Google Analytics events that measure how far down the page visitors are actually seeing. This report, in combination with the Readers vs. Scanners report, helps understand reader engagement better than any generic “Time on Site” metric can do.
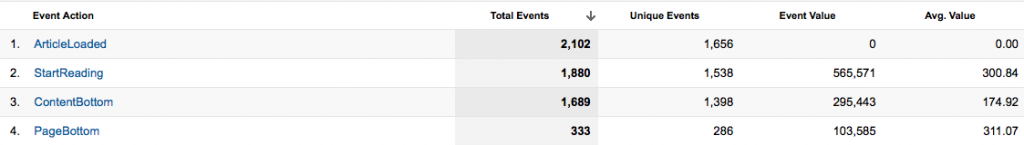
From this report, I can see that of the 2,102 articles loaded:
- 89.4% of the articles have a “StartReading” event fired
- 89.8% of those who start to read an article reach the bottom of the article.
- 19.7% of those who reach the end of the article scroll past the comments to reach the true end of page
The first metric above is analogous to subtracting the bounce rate from 1, the percentage of articles viewed that don’t bounce. The second metric (complete articles seen), with a success rate of 89.8% is ripe for segmentation. I stated above that only 38% actually READ an article, so segmenting the above report by “Readers” vs. “Scanners” will surely lower the success rate in the “Readers” population.
Finally, that <20% actually touch the true bottom of page is surprising to me, since this blog really doesn’t get many comments! If there were thousands of comments and the pages were really long, ok, no one sees the bottom…but here? I’ll have to think about this a bit.
Great update to Google Analytics default settings!
Overall, my impression of the jQuery code snippet developed by Justin and others is that it is extremely useful in understand interaction of visitors to content sites. The only downside I see here is that it changes the definition of bounce rate within Google Analytics, which could be confusing to others who 1) aren’t aware of the code snippet running on-site or 2) don’t quite understand the subtleties of Google Analytics implementation with respect to Events and the non-interaction setting.
But since this is my personal blog, I don’t need to worry about others mis-interpreting my Google Analytics data, so I’m going to keep this functionality installed!
Update 7/25/12: Google Analytics published a similar method to the one described above, using “setTimeout” to modify bounce rate based solely on time-on-page.