Getting Started Using R, Part 1: RStudio

Despite my preference for SAS over R, there are some add-ons to “basic” R that I’ve found that have made my learning process way easier. While I’m still in my infancy in learning R, I feel like once I found these additional tools, my ability to use R to get work done improved significantly.

In this first post of three, I’ll discuss RStudio, a more friendly access point to the default installation of R.  My second post will discuss Rcmdr, a GUI developed for students taking a basic college-level course in Statistics.  The third post will cover rattle, a GUI specifically designed for data mining (as opposed to more general statistics like Rcmdr).

RStudio

r-studio

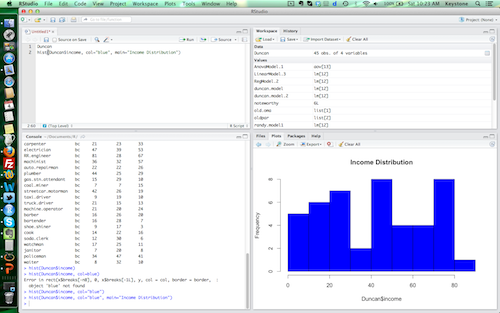
R Studio is an IDE that dramatically improves the R experience

RStudio is an open-source Integrated Development Environment (IDE) that provides a more consistent user experience to R.  There are many great features of RStudio over “basic” R, including:

  • Consistent windowing between sessions (customizable by the user)
  • Point-and-click exploration of data frames and other data objects
  • Importing data files through dialog box functionality
  • Customizable code syntax highlighting, auto-complete, and Help menu access from the code editor
  • Ability to see all installed packages, turn on packages using a checkbox, and download libraries (and their dependencies) without having to write any code
  • Version Control using GitHub

While RStudio doesn’t provide a GUI that will help you run a regression model or build a graph, it provides a more “friendly” environment to work in as compared to the command-line interface of a default installation of R.  I find that by having elements like the currently active data objects and available/active packages with links to the Help files “exposed” at all times, RStudio reminds me of where my analysis has been and gives me a quick way to think about “What Else?” to pursue if I hit a roadblock.

Installation of RStudio

RStudio installs like any other program for Windows or Mac OSX.  As far as I can tell, there are no advantages to using RStudio in either environment, both the Windows and OSX versions seem to work equally well.  The most important consideration is that RStudio is just an “add-on” so-to-speak, it does not include R itself.  So be sure to go to one of the Comprehensive R Archive Network (CRAN) sites to download R first.

  • RSiteCatalyst Version 1.4.16 Release Notes
  • Using RSiteCatalyst With Microsoft PowerBI Desktop
  • RSiteCatalyst Version 1.4.14 Release Notes
  • RSiteCatalyst Version 1.4.13 Release Notes
  • RSiteCatalyst Version 1.4.12 (and 1.4.11) Release Notes
  • Self-Service Adobe Analytics Data Feeds!
  • RSiteCatalyst Version 1.4.10 Release Notes
  • WordPress to Jekyll: A 30x Speedup
  • Bulk Downloading Adobe Analytics Data
  • Adobe Analytics Clickstream Data Feed: Calculations and Outlier Analysis
  • Adobe: Give Credit. You DID NOT Write RSiteCatalyst.
  • RSiteCatalyst Version 1.4.8 Release Notes
  • Adobe Analytics Clickstream Data Feed: Loading To Relational Database
  • Calling RSiteCatalyst From Python
  • RSiteCatalyst Version 1.4.7 (and 1.4.6.) Release Notes
  • RSiteCatalyst Version 1.4.5 Release Notes
  • Getting Started: Adobe Analytics Clickstream Data Feed
  • RSiteCatalyst Version 1.4.4 Release Notes
  • RSiteCatalyst Version 1.4.3 Release Notes
  • RSiteCatalyst Version 1.4.2 Release Notes
  • Destroy Your Data Using Excel With This One Weird Trick!
  • RSiteCatalyst Version 1.4.1 Release Notes
  • Visualizing Website Pathing With Sankey Charts
  • Visualizing Website Structure With Network Graphs
  • RSiteCatalyst Version 1.4 Release Notes
  • Maybe I Don't Really Know R After All
  • Building JSON in R: Three Methods
  • Real-time Reporting with the Adobe Analytics API
  • RSiteCatalyst Version 1.3 Release Notes
  • Adobe Analytics Implementation Documentation in 60 Seconds
  • RSiteCatalyst Version 1.2 Release Notes
  • Clustering Search Keywords Using K-Means Clustering
  • RSiteCatalyst Version 1.1 Release Notes
  • Anomaly Detection Using The Adobe Analytics API
  • (not provided): Using R and the Google Analytics API
  • My Top 20 Least Useful Omniture Reports
  • For Maximum User Understanding, Customize the SiteCatalyst Menu
  • Effect Of Modified Bounce Rate In Google Analytics
  • Adobe Discover 3: First Impressions
  • Using Omniture SiteCatalyst Target Report To Calculate YOY growth
  • ODSC webinar: End-to-End Data Science Without Leaving the GPU
  • PyData NYC 2018: End-to-End Data Science Without Leaving the GPU
  • Data Science Without Leaving the GPU
  • Getting Started With OmniSci, Part 2: Electricity Dataset
  • Getting Started With OmniSci, Part 1: Docker Install and Loading Data
  • Parallelizing Distance Calculations Using A GPU With CUDAnative.jl
  • Building a Data Science Workstation (2017)
  • JuliaCon 2015: Everyday Analytics and Visualization (video)
  • Vega.jl, Rebooted
  • Sessionizing Log Data Using data.table [Follow-up #2]
  • Sessionizing Log Data Using dplyr [Follow-up]
  • Sessionizing Log Data Using SQL
  • Review: Data Science at the Command Line
  • Introducing Twitter.jl
  • Code Refactoring Using Metaprogramming
  • Evaluating BreakoutDetection
  • Creating A Stacked Bar Chart in Seaborn
  • Visualizing Analytics Languages With VennEuler.jl
  • String Interpolation for Fun and Profit
  • Using Julia As A "Glue" Language
  • Five Hard-Won Lessons Using Hive
  • Using SQL Workbench with Apache Hive
  • Getting Started With Hadoop, Final: Analysis Using Hive & Pig
  • Quickly Create Dummy Variables in a Data Frame
  • Using Amazon EC2 with IPython Notebook
  • Adding Line Numbers in IPython/Jupyter Notebooks
  • Fun With Just-In-Time Compiling: Julia, Python, R and pqR
  • Getting Started Using Hadoop, Part 4: Creating Tables With Hive
  • Tabular Data I/O in Julia
  • Hadoop Streaming with Amazon Elastic MapReduce, Python and mrjob
  • A Beginner's Look at Julia
  • Getting Started Using Hadoop, Part 3: Loading Data
  • Innovation Will Never Be At The Push Of A Button
  • Getting Started Using Hadoop, Part 2: Building a Cluster
  • Getting Started Using Hadoop, Part 1: Intro
  • Instructions for Installing & Using R on Amazon EC2
  • Video: SQL Queries in R using sqldf
  • Video: Overlay Histogram in R (Normal, Density, Another Series)
  • Video: R, RStudio, Rcmdr & rattle
  • Getting Started Using R, Part 2: Rcmdr
  • Getting Started Using R, Part 1: RStudio
  • Learning R Has Really Made Me Appreciate SAS