RSiteCatalyst Version 1.4.3 Release Notes

It’s a new year, so…new version of RSiteCatalyst on CRAN! For the most part, this release fixes a handful of bugs that weren’t noticed with the prior release 1.4.2 (oops!), but there are pieces of additional functionality.

New functionality: Data Feed monitoring

For those of you having hourly or daily data feeds delivered via FTP, you can now find out the details of a data feed and all of a company’s feeds & the processing status of each using GetFeed() and GetFeeds() respectively.

For example, calling GetFeed() with a specific feed number will return the following information as a data frame:

rsitecatalyst-getfeed

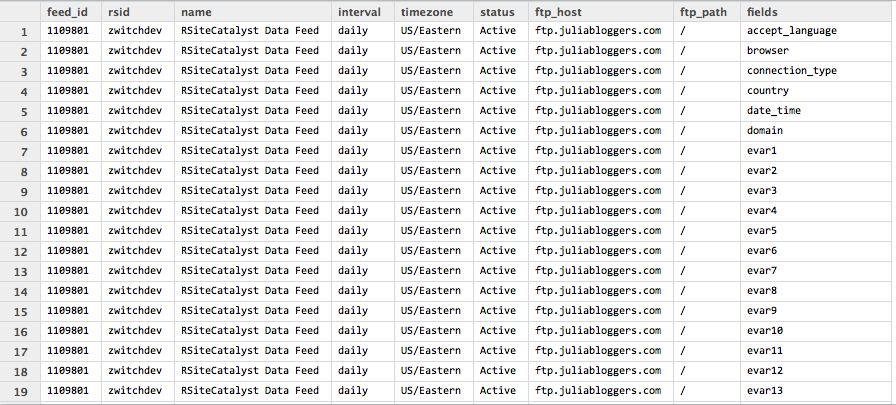
Similarly, if you call GetFeeds("report-suite"), you’ll get the following information as a data frame:

rsitecatalyst-getfeeds

I only have one feed set up for testing, but if there were more feeds delivered each day, they would show up as additional rows in the data frame. The interpretation here is that the daily feed for 1/5/15 was delivered (the 05:00:00 is GMT).

Bug Fixes

RSiteCatalyst v1.4.2 attempted to fix an issue where QueueRanked would error if two SAINT classifications were used. Unfortunately, by fixing that issue, QueueRanked ONLY worked with SAINT Classifications. This was only out in the wild for a month, so hopefully it didn’t really affect anyone.

Additionally, the segment.id and segment.name weren’t printing out to the data frame in the Queue* functions. This has also been fixed.

Test Suite Using Travis CI

To avoid future errors like the ones mentioned above, a full test suite using testthat has been added to RSiteCatalyst and monitored via Travis CI. While there is coverage for every public function within the package, there are likely additional tests that can be added for functionality I didn’t cover. If anyone out there has particularly weird cases they use and aren’t incorporated in the test suite, please feel free to file an issue or submit a pull request and I’ll figure out how to incorporate it into the test suite.

DataWarehouse API

Finally, the last bit of changes to RSiteCatalyst in v1.4.3 are internal preparations for a new package I plan to release in the coming months: AdobeDW. Several folks have asked for the ability to control Data Warehouse reports via R; for various reasons, I thought it made sense to break this out from RSiteCatalyst into its own package. If there are any R-and-Adobe-Analytics enthusiasts out there that would like to help development, please let me know!

Feature Requests/Bugs

As always, if you come across bugs or have feature requests, please continue to use the RSiteCatalyst GitHub Issues page to submit issues. Don’t worry about cluttering up the page with tickets, please fill out a new issue for anything you encounter (with code you’ve already tried and is failing), unless you are SURE that it is the same problem someone else is facing.

And finally, like I end every blog post about RSiteCatalyst, please note that I’m not an Adobe employee. This hasn’t been an issue for a few months, so maybe next time I won’t end the post with this boilerplate :)

  • RSiteCatalyst Version 1.4.16 Release Notes
  • Using RSiteCatalyst With Microsoft PowerBI Desktop
  • RSiteCatalyst Version 1.4.14 Release Notes
  • RSiteCatalyst Version 1.4.13 Release Notes
  • RSiteCatalyst Version 1.4.12 (and 1.4.11) Release Notes
  • Self-Service Adobe Analytics Data Feeds!
  • RSiteCatalyst Version 1.4.10 Release Notes
  • WordPress to Jekyll: A 30x Speedup
  • Bulk Downloading Adobe Analytics Data
  • Adobe Analytics Clickstream Data Feed: Calculations and Outlier Analysis
  • Adobe: Give Credit. You DID NOT Write RSiteCatalyst.
  • RSiteCatalyst Version 1.4.8 Release Notes
  • Adobe Analytics Clickstream Data Feed: Loading To Relational Database
  • Calling RSiteCatalyst From Python
  • RSiteCatalyst Version 1.4.7 (and 1.4.6.) Release Notes
  • RSiteCatalyst Version 1.4.5 Release Notes
  • Getting Started: Adobe Analytics Clickstream Data Feed
  • RSiteCatalyst Version 1.4.4 Release Notes
  • RSiteCatalyst Version 1.4.3 Release Notes
  • RSiteCatalyst Version 1.4.2 Release Notes
  • Destroy Your Data Using Excel With This One Weird Trick!
  • RSiteCatalyst Version 1.4.1 Release Notes
  • Visualizing Website Pathing With Sankey Charts
  • Visualizing Website Structure With Network Graphs
  • RSiteCatalyst Version 1.4 Release Notes
  • Maybe I Don't Really Know R After All
  • Building JSON in R: Three Methods
  • Real-time Reporting with the Adobe Analytics API
  • RSiteCatalyst Version 1.3 Release Notes
  • Adobe Analytics Implementation Documentation in 60 Seconds
  • RSiteCatalyst Version 1.2 Release Notes
  • Clustering Search Keywords Using K-Means Clustering
  • RSiteCatalyst Version 1.1 Release Notes
  • Anomaly Detection Using The Adobe Analytics API
  • (not provided): Using R and the Google Analytics API
  • My Top 20 Least Useful Omniture Reports
  • For Maximum User Understanding, Customize the SiteCatalyst Menu
  • Effect Of Modified Bounce Rate In Google Analytics
  • Adobe Discover 3: First Impressions
  • Using Omniture SiteCatalyst Target Report To Calculate YOY growth
  • ODSC webinar: End-to-End Data Science Without Leaving the GPU
  • PyData NYC 2018: End-to-End Data Science Without Leaving the GPU
  • Data Science Without Leaving the GPU
  • Getting Started With OmniSci, Part 2: Electricity Dataset
  • Getting Started With OmniSci, Part 1: Docker Install and Loading Data
  • Parallelizing Distance Calculations Using A GPU With CUDAnative.jl
  • Building a Data Science Workstation (2017)
  • JuliaCon 2015: Everyday Analytics and Visualization (video)
  • Vega.jl, Rebooted
  • Sessionizing Log Data Using data.table [Follow-up #2]
  • Sessionizing Log Data Using dplyr [Follow-up]
  • Sessionizing Log Data Using SQL
  • Review: Data Science at the Command Line
  • Introducing Twitter.jl
  • Code Refactoring Using Metaprogramming
  • Evaluating BreakoutDetection
  • Creating A Stacked Bar Chart in Seaborn
  • Visualizing Analytics Languages With VennEuler.jl
  • String Interpolation for Fun and Profit
  • Using Julia As A "Glue" Language
  • Five Hard-Won Lessons Using Hive
  • Using SQL Workbench with Apache Hive
  • Getting Started With Hadoop, Final: Analysis Using Hive & Pig
  • Quickly Create Dummy Variables in a Data Frame
  • Using Amazon EC2 with IPython Notebook
  • Adding Line Numbers in IPython/Jupyter Notebooks
  • Fun With Just-In-Time Compiling: Julia, Python, R and pqR
  • Getting Started Using Hadoop, Part 4: Creating Tables With Hive
  • Tabular Data I/O in Julia
  • Hadoop Streaming with Amazon Elastic MapReduce, Python and mrjob
  • A Beginner's Look at Julia
  • Getting Started Using Hadoop, Part 3: Loading Data
  • Innovation Will Never Be At The Push Of A Button
  • Getting Started Using Hadoop, Part 2: Building a Cluster
  • Getting Started Using Hadoop, Part 1: Intro
  • Instructions for Installing & Using R on Amazon EC2
  • Video: SQL Queries in R using sqldf
  • Video: Overlay Histogram in R (Normal, Density, Another Series)
  • Video: R, RStudio, Rcmdr & rattle
  • Getting Started Using R, Part 2: Rcmdr
  • Getting Started Using R, Part 1: RStudio
  • Learning R Has Really Made Me Appreciate SAS