Using RSiteCatalyst With Microsoft PowerBI Desktop

With pretty regular frequency I get emails asking if RSiteCatalyst can be used with Microsoft Power BI. While admittedly I’m not a frequent user of the Windows operating system (nor dashboarding tools like Tableau or Power BI), I am pleased to report that it is fact possible to call the Adobe Analytics API with Power BI via RSiteCatalyst!

Step 1: Call Adobe Analytics API Using Get Data Menu

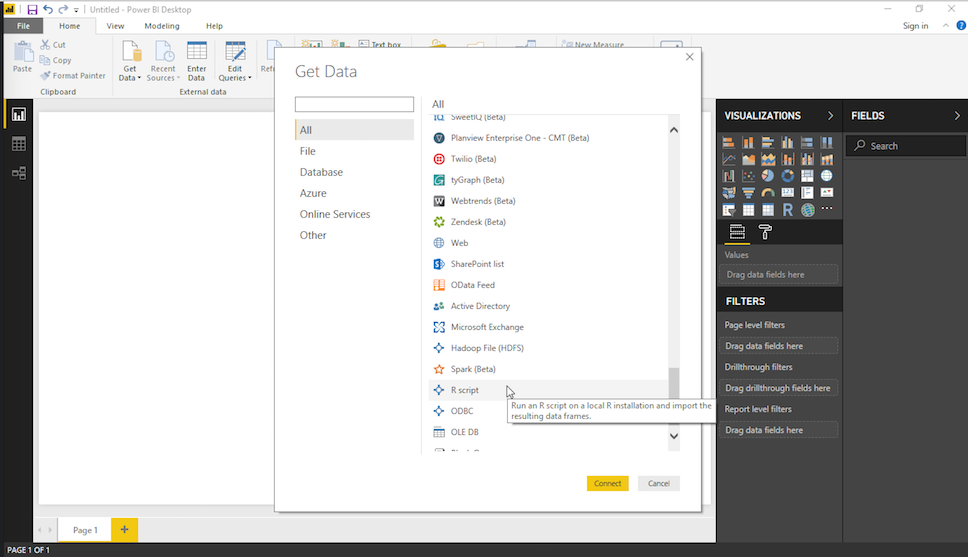
The majority of getting RSiteCatalyst to work within Power BI desktop is getting the R script correct. From the Get Data menu, choose the More... menu option to bring up all of the data import tools that Power BI defines:

rsitecatalyst powerbi get data

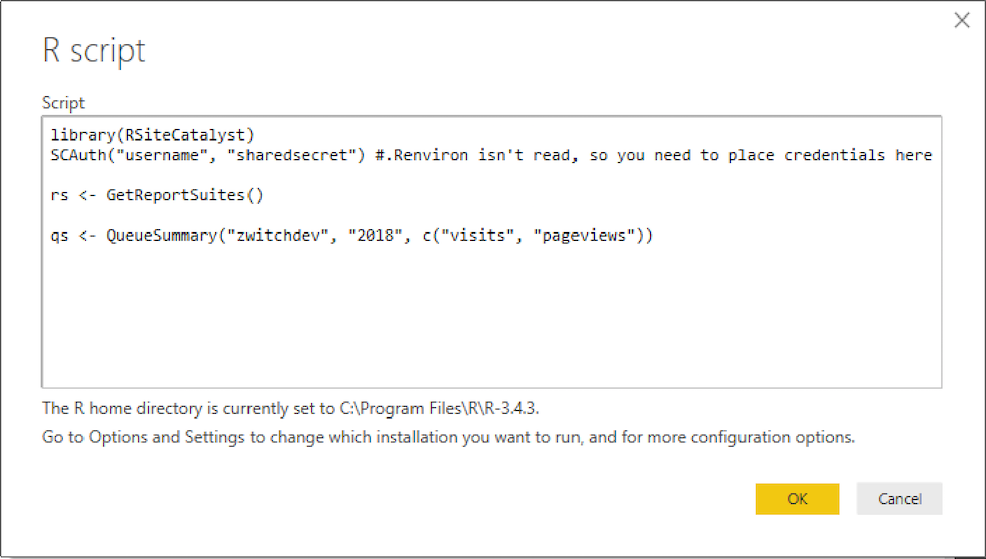
Once you choose ‘R Script’, an input box will open where you can place your RSiteCatalyst function calls:

rsitecatalyst powerbi rscript

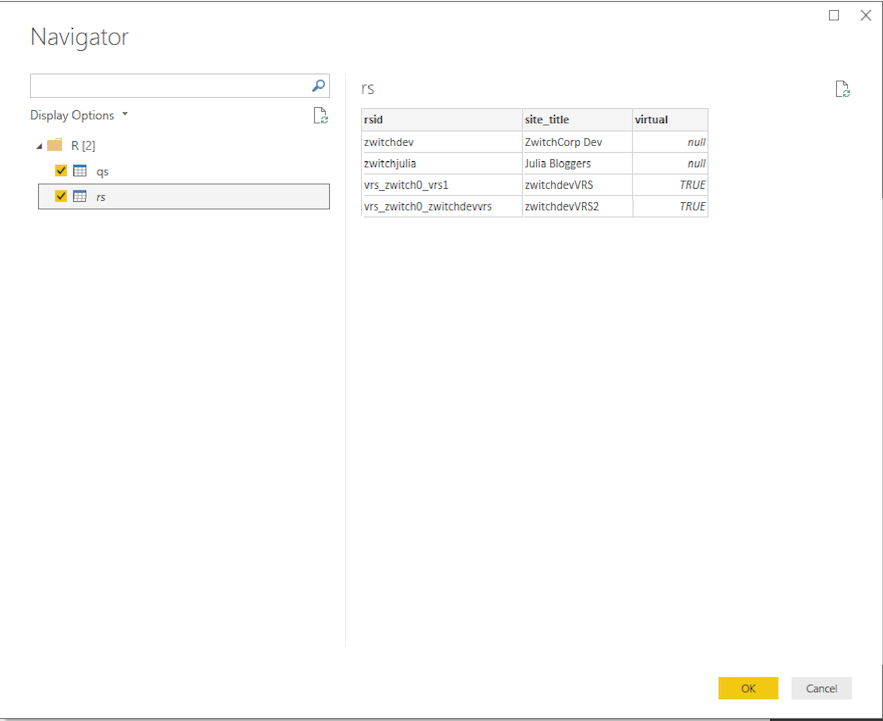
After hitting ‘OK’, Power BI will evaluate your R code, determining which statements return a data.frame (which is the only allowable data structure imported into Power BI). You can choose which data.frame(s) you want to import from the ‘Navigator’ window:

rsitecatalyst powerbi navigator

Once you hit ‘OK’, Power BI imports the data and you can use your Adobe Analytics data just as you would in R with RSiteCatalyst (or, like any other data source like CSV or database…)

Limitations

While it’s possible to call RSiteCatalyst through Power BI, there are some limitations to keep in mind.

First, RSiteCatalyst will only work with Microsoft Power BI Desktop, which is installed locally on your machine. The Power BI Service, which is more of a shared dashboard/data store environment, does not allow external API calls as part of its security model. So while you can analyze your data locally, you cannot share dashboards to the Power BI Service.

The second limitation I’ve noticed is that Power BI doesn’t read from from a .Renviron file (at least, not from the default Windows location that R GUI reads). So you will need to place your credentials directly in the R script, which is never really ideal (though, may not be a big deal all things considered).

Finally, the R script runs synchronously, so when placing multiple calls in the same R script you will need to wait for all of the data.frame results before you can use them within Power BI. This is the same default behavior within R, sans using Promises or parallelism of some sort, but it’s still important to keep in mind.

Dashboards, Dashboards, Dashboards!

With a few minutes work, I was able to create this rudimentary dashboard (R code):

rsitecatalyst powerbi dashboard

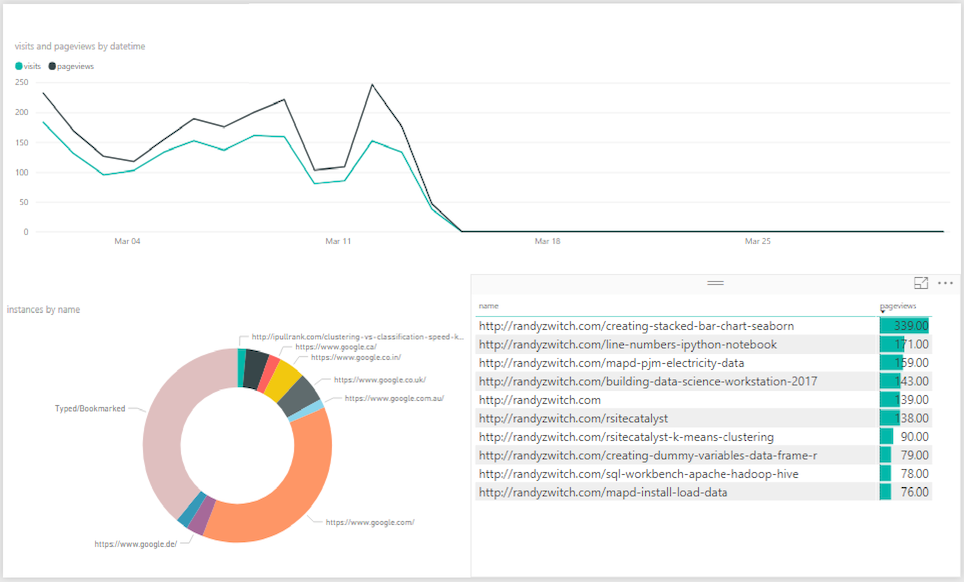
Someone with more interesting/higher volume data could surely do better. But the most important thing in my opinion is that Microsoft has built an awesome integration with R and that creating dashboards in Power BI is waaaaaay easier than the last time I tried to create a dashboard using Excel and the Adobe Report Builder plugin.

Happy dashboarding!

  • RSiteCatalyst Version 1.4.16 Release Notes
  • Using RSiteCatalyst With Microsoft PowerBI Desktop
  • RSiteCatalyst Version 1.4.14 Release Notes
  • RSiteCatalyst Version 1.4.13 Release Notes
  • RSiteCatalyst Version 1.4.12 (and 1.4.11) Release Notes
  • Self-Service Adobe Analytics Data Feeds!
  • RSiteCatalyst Version 1.4.10 Release Notes
  • WordPress to Jekyll: A 30x Speedup
  • Bulk Downloading Adobe Analytics Data
  • Adobe Analytics Clickstream Data Feed: Calculations and Outlier Analysis
  • Adobe: Give Credit. You DID NOT Write RSiteCatalyst.
  • RSiteCatalyst Version 1.4.8 Release Notes
  • Adobe Analytics Clickstream Data Feed: Loading To Relational Database
  • Calling RSiteCatalyst From Python
  • RSiteCatalyst Version 1.4.7 (and 1.4.6.) Release Notes
  • RSiteCatalyst Version 1.4.5 Release Notes
  • Getting Started: Adobe Analytics Clickstream Data Feed
  • RSiteCatalyst Version 1.4.4 Release Notes
  • RSiteCatalyst Version 1.4.3 Release Notes
  • RSiteCatalyst Version 1.4.2 Release Notes
  • Destroy Your Data Using Excel With This One Weird Trick!
  • RSiteCatalyst Version 1.4.1 Release Notes
  • Visualizing Website Pathing With Sankey Charts
  • Visualizing Website Structure With Network Graphs
  • RSiteCatalyst Version 1.4 Release Notes
  • Maybe I Don't Really Know R After All
  • Building JSON in R: Three Methods
  • Real-time Reporting with the Adobe Analytics API
  • RSiteCatalyst Version 1.3 Release Notes
  • Adobe Analytics Implementation Documentation in 60 Seconds
  • RSiteCatalyst Version 1.2 Release Notes
  • Clustering Search Keywords Using K-Means Clustering
  • RSiteCatalyst Version 1.1 Release Notes
  • Anomaly Detection Using The Adobe Analytics API
  • (not provided): Using R and the Google Analytics API
  • My Top 20 Least Useful Omniture Reports
  • For Maximum User Understanding, Customize the SiteCatalyst Menu
  • Effect Of Modified Bounce Rate In Google Analytics
  • Adobe Discover 3: First Impressions
  • Using Omniture SiteCatalyst Target Report To Calculate YOY growth
  • ODSC webinar: End-to-End Data Science Without Leaving the GPU
  • PyData NYC 2018: End-to-End Data Science Without Leaving the GPU
  • Data Science Without Leaving the GPU
  • Getting Started With OmniSci, Part 2: Electricity Dataset
  • Getting Started With OmniSci, Part 1: Docker Install and Loading Data
  • Parallelizing Distance Calculations Using A GPU With CUDAnative.jl
  • Building a Data Science Workstation (2017)
  • JuliaCon 2015: Everyday Analytics and Visualization (video)
  • Vega.jl, Rebooted
  • Sessionizing Log Data Using data.table [Follow-up #2]
  • Sessionizing Log Data Using dplyr [Follow-up]
  • Sessionizing Log Data Using SQL
  • Review: Data Science at the Command Line
  • Introducing Twitter.jl
  • Code Refactoring Using Metaprogramming
  • Evaluating BreakoutDetection
  • Creating A Stacked Bar Chart in Seaborn
  • Visualizing Analytics Languages With VennEuler.jl
  • String Interpolation for Fun and Profit
  • Using Julia As A "Glue" Language
  • Five Hard-Won Lessons Using Hive
  • Using SQL Workbench with Apache Hive
  • Getting Started With Hadoop, Final: Analysis Using Hive & Pig
  • Quickly Create Dummy Variables in a Data Frame
  • Using Amazon EC2 with IPython Notebook
  • Adding Line Numbers in IPython/Jupyter Notebooks
  • Fun With Just-In-Time Compiling: Julia, Python, R and pqR
  • Getting Started Using Hadoop, Part 4: Creating Tables With Hive
  • Tabular Data I/O in Julia
  • Hadoop Streaming with Amazon Elastic MapReduce, Python and mrjob
  • A Beginner's Look at Julia
  • Getting Started Using Hadoop, Part 3: Loading Data
  • Innovation Will Never Be At The Push Of A Button
  • Getting Started Using Hadoop, Part 2: Building a Cluster
  • Getting Started Using Hadoop, Part 1: Intro
  • Instructions for Installing & Using R on Amazon EC2
  • Video: SQL Queries in R using sqldf
  • Video: Overlay Histogram in R (Normal, Density, Another Series)
  • Video: R, RStudio, Rcmdr & rattle
  • Getting Started Using R, Part 2: Rcmdr
  • Getting Started Using R, Part 1: RStudio
  • Learning R Has Really Made Me Appreciate SAS