@nancyskoons @randyzwitch @shawncreed Best Practice #1: Customizing anything is better than customizing nothing. #measure #omniture
— Jason Egan (@jasonegan) June 6, 2012
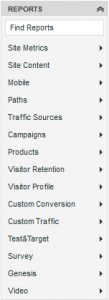
Default Omniture report menu
Visits vs. Visitors vs. Unique Visitors…click-throughs, view-throughs, bounces…these concepts in digital analytics are fairly abstract, and many in business and marketing never really grasp the concepts fully. Knowing the enormous amount of learning that needs to take place for digital success, why do we make our internal stakeholders hunt for data that’s organized by TOOL definitions, instead of by business function?
In this case, the “tool” that I’m referring to here is Omniture SiteCatalyst. To be clear, there’s nothing excessively wrong about the default menu structure in Omniture, just that in my experience, understanding by end-users can be greatly enhanced by customizing the Omniture menu.
Simple modifications such as 1) Hiding Omniture variables and products not in use, 2) organizing reports by logical business function, and 3) placing custom reports and calculated metrics next to the standard SiteCatalyst reports will get users to making decisions with their data that much faster.
1) Hide Omniture variables and products not being used
Do your users a favor and hide the Omniture products such as Test & Target, Survey, and Genesis if you aren’t using them. Same thing with any custom traffic (props) and custom conversion variables (eVars) that aren’t being used. Nothing will distract your users faster than clicking on folders with advertisements (T&T, Survey) or worse, frustrate the user by making them wonder “What data is supposed to be in this report?”
Just by hiding or disabling these empty reports and tools advertisements, you should see an increased confidence in data quality. Or at the very least, keep the conversation from taking a detour.
2) Organize SiteCatalyst reports by logical business function
Your internal users aren’t thinking about Omniture variable structures when they are trying to find the answer to their business questions. So why do we keep our data artificially separated by “Custom Events”, “Custom Conversions” and “Custom Traffic”?
Worse yet, who remembers that the number of Facebook Likes can be found at “Site Metrics -> Custom Events -> Custom Events 21-30?” And why are Facebook Likes next to “Logins”? Does that mean Facebook Logins? Probably not.
Wouldn’t it be better for our users to organize reports by business function, such as:
- Financial/Purchase Metrics (Revenue, Discounts, Shipping, AOV, Units, Revenue Per Visit)
- Usability (Browser, Percent of Page Viewed, Operating System)
- SEO (Non-campaign visits, Referring Domains)
- Mobile (Device, browser, resolution)
- Site Engagement (Page Views, Internal Campaigns, Logins)
- Site Merchandising (Products Viewed, Cart Add Ratio, Cross-Sell)
- Social (Facebook Likes, Pinterest Pins, Visits from Social domains)
- Paid Campaigns (Email, Paid Search, Display)
- Traffic (Total Visits, Geosegmentation)
The list above isn’t meant to be exhaustive, or necessarily how you should organize your SiteCatalyst menus. But for me, organizing the reports by the business function keeps my business thinking flowing, rather than trying to remember how Omniture was implemented by variable type.
3) Place custom reports and calculated metrics next to the standard SiteCatalyst reports
This is probably more like “2b” to the above, but there’s no reason to keep custom reports and calculated metric reports segregated either. Custom reports happen because of a specific business need, and the same thing with calculated metrics. By placing these reports along with the out-of-the-box reports from SiteCatalyst, you take away the artificial distinction between data natively in SiteCatalyst and business-specific data populated by a web developer.
Why you wouldn’t want to customize?
Shawn makes two great points in his post about (not) customizing the SiteCatalyst menu: users require special training and menu customization isn’t scalable.
Users need special training
Users need to be trained anyway. I don’t think either of us is suggesting moving all of the menus around after an implementation has been in place for years…but if you’re a company just starting out, why not start off customized?
Fellow Keystoner Tim Patten also commented to me via Twitter DM about power users being used to “default”, and it’s annoying have to learn a new menu when switching companies; I’m not really worried about power users, I’m thinking about the hundreds of users in thousands of organizations who can’t get beyond page views and visits. Power users can pick up a new menu quickly, switch back to default, or use the search box.
Menu Customization isn’t scalable
This is very much true. The larger the company, and the more complex and varied the tracking, inevitably menu customization isn’t particularly scalable. This is probably an area where specific dashboards are a much better strategy than customizing the menus.
Summary
For me, one of the first things I look for when working with a company looking to get their digital analytics program off the ground is whether they’ve customized their Omniture menu structure. As a free customization, it’s something that companies should at least consider. Organizing reports by business function requires a business to think about the questions they want to regularly answer, will keep novice users from focusing on implementation concepts, and overall is just better because it’s how I think 🙂
This blog post is a continuation of a Twitter conversation with Shawn C. Reed (@shawncreed), Jason Egan (@jasonegan), Tim Patten (@timpatten) and others. Shawn’s counter-argument can be found here. Jason wrote about Omniture menu customization a few years back. And finally, if you want to read more pros-and-cons about SiteCatalyst menu customization, see the Adobe blog posts here and here.