Getting Started Using R, Part 2: Rcmdr

In my first post in this series, I discussed RStudio, an IDE that adds significant functionality and consistency to a basic installation of R.  In this post, I will discuss Rcmdr, a GUI that provides the ability to do basic business statistics without having to code in R.

Rcmdr (“R Commander”)

rcmdr

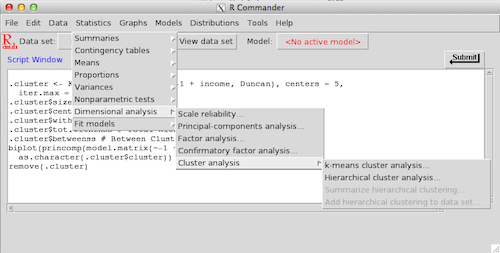
Example Rcmdr window with the "Statistics" menu expanded

Rcmdr is a package for R that was created by John Fox at McMaster University in Canada as a means of providing the basic statistics functionality for classroom use.  In this way, Rcmdr is somewhat similar to SAS Enterprise Guide, a GUI that allows quick access to the power of SAS without the requirement of writing code.

While using Rcmdr won’t allow you to tap into every single advanced feature that R provides, it does provide a lot of great “general” functionality that can be used in everyday business such as summary statistics, t-tests, ANOVA, linear regression modeling, graphing and data re-coding.

Using Rcmdr

For the most part, the Rcmdr dialog boxes all look very similar.  Only the most useful options are provided, such as the variable(s) you are looking to interrogate, variable(s) you’d like to break down your analysis by, what statistics you want the output to display (mean, median, mode, etc.) and so on.  The dialog boxes vary depending on whether you are estimating a model or plotting a graph, but in my preliminary usage I haven’t found any dialog boxes that were so confusing that I needed to check the “Help” files.

For example, suppose I wanted to make a boxplot of my data, income by job type. To do so, I would go to the “Graphs” menu and select “Boxplot”, which provides me with the following dialog box:

rcmdr-boxplot-dialog-box

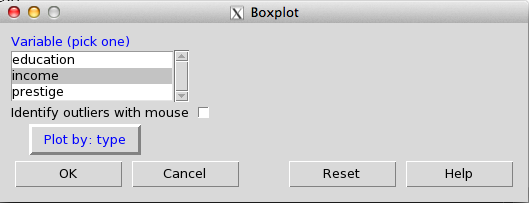
Rcmdr options for creating a Boxplot

rcmdr-boxplot

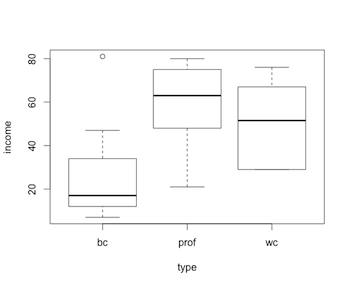
Boxplot output created by Rcmdr

Within this dialog box, there are only 3 choices:  variable to plot (income), variable to break down the graph by (type), and “Identify outliers with mouse”, which allows for the user to point at the resulting graph to designate outliers to be labeled on the graph.  When I click “OK” in the dialog box, the result is the boxplot shown above. We can see that the “bc” (blue-collar) group has a lower mid-point to the  income range than “prof” (professors) and “wc” (white-collar).

One of the best features of Rcmdr is that not only do we get the output we requested, but the code window also shows the code that was necessary to create the boxplot.  In this example, the underlying R code is relatively simple:

1
boxplot(income~type, ylab="income", xlab="type", data=Duncan)

By providing the underlying code, Rcmdr serves as a teaching tool to move the beginning user towards coding in R directly, or at least, modifying the tool-generated code to include titles or whatever options the user wants to add to the original analysis/output.

Installation of Rcmdr

Sadly, Rcmdr is one of those add-ins that seems to work better on Windows than Mac OSX, at least for the installation portion. I’ve been able to successfully install Rcmdr on my relatively old MacBook Pro, but it did take a bit of time to figure out.  Luckily, the instructions to install Rcmdr on a Mac are fairly well laid out in this article.

However, once you get over the hurdle of downloading tcltk and XQuartz (X11 emulator), the program seems to work the same on both platforms.

  • RSiteCatalyst Version 1.4.16 Release Notes
  • Using RSiteCatalyst With Microsoft PowerBI Desktop
  • RSiteCatalyst Version 1.4.14 Release Notes
  • RSiteCatalyst Version 1.4.13 Release Notes
  • RSiteCatalyst Version 1.4.12 (and 1.4.11) Release Notes
  • Self-Service Adobe Analytics Data Feeds!
  • RSiteCatalyst Version 1.4.10 Release Notes
  • WordPress to Jekyll: A 30x Speedup
  • Bulk Downloading Adobe Analytics Data
  • Adobe Analytics Clickstream Data Feed: Calculations and Outlier Analysis
  • Adobe: Give Credit. You DID NOT Write RSiteCatalyst.
  • RSiteCatalyst Version 1.4.8 Release Notes
  • Adobe Analytics Clickstream Data Feed: Loading To Relational Database
  • Calling RSiteCatalyst From Python
  • RSiteCatalyst Version 1.4.7 (and 1.4.6.) Release Notes
  • RSiteCatalyst Version 1.4.5 Release Notes
  • Getting Started: Adobe Analytics Clickstream Data Feed
  • RSiteCatalyst Version 1.4.4 Release Notes
  • RSiteCatalyst Version 1.4.3 Release Notes
  • RSiteCatalyst Version 1.4.2 Release Notes
  • Destroy Your Data Using Excel With This One Weird Trick!
  • RSiteCatalyst Version 1.4.1 Release Notes
  • Visualizing Website Pathing With Sankey Charts
  • Visualizing Website Structure With Network Graphs
  • RSiteCatalyst Version 1.4 Release Notes
  • Maybe I Don't Really Know R After All
  • Building JSON in R: Three Methods
  • Real-time Reporting with the Adobe Analytics API
  • RSiteCatalyst Version 1.3 Release Notes
  • Adobe Analytics Implementation Documentation in 60 Seconds
  • RSiteCatalyst Version 1.2 Release Notes
  • Clustering Search Keywords Using K-Means Clustering
  • RSiteCatalyst Version 1.1 Release Notes
  • Anomaly Detection Using The Adobe Analytics API
  • (not provided): Using R and the Google Analytics API
  • My Top 20 Least Useful Omniture Reports
  • For Maximum User Understanding, Customize the SiteCatalyst Menu
  • Effect Of Modified Bounce Rate In Google Analytics
  • Adobe Discover 3: First Impressions
  • Using Omniture SiteCatalyst Target Report To Calculate YOY growth
  • ODSC webinar: End-to-End Data Science Without Leaving the GPU
  • PyData NYC 2018: End-to-End Data Science Without Leaving the GPU
  • Data Science Without Leaving the GPU
  • Getting Started With OmniSci, Part 2: Electricity Dataset
  • Getting Started With OmniSci, Part 1: Docker Install and Loading Data
  • Parallelizing Distance Calculations Using A GPU With CUDAnative.jl
  • Building a Data Science Workstation (2017)
  • JuliaCon 2015: Everyday Analytics and Visualization (video)
  • Vega.jl, Rebooted
  • Sessionizing Log Data Using data.table [Follow-up #2]
  • Sessionizing Log Data Using dplyr [Follow-up]
  • Sessionizing Log Data Using SQL
  • Review: Data Science at the Command Line
  • Introducing Twitter.jl
  • Code Refactoring Using Metaprogramming
  • Evaluating BreakoutDetection
  • Creating A Stacked Bar Chart in Seaborn
  • Visualizing Analytics Languages With VennEuler.jl
  • String Interpolation for Fun and Profit
  • Using Julia As A "Glue" Language
  • Five Hard-Won Lessons Using Hive
  • Using SQL Workbench with Apache Hive
  • Getting Started With Hadoop, Final: Analysis Using Hive & Pig
  • Quickly Create Dummy Variables in a Data Frame
  • Using Amazon EC2 with IPython Notebook
  • Adding Line Numbers in IPython/Jupyter Notebooks
  • Fun With Just-In-Time Compiling: Julia, Python, R and pqR
  • Getting Started Using Hadoop, Part 4: Creating Tables With Hive
  • Tabular Data I/O in Julia
  • Hadoop Streaming with Amazon Elastic MapReduce, Python and mrjob
  • A Beginner's Look at Julia
  • Getting Started Using Hadoop, Part 3: Loading Data
  • Innovation Will Never Be At The Push Of A Button
  • Getting Started Using Hadoop, Part 2: Building a Cluster
  • Getting Started Using Hadoop, Part 1: Intro
  • Instructions for Installing & Using R on Amazon EC2
  • Video: SQL Queries in R using sqldf
  • Video: Overlay Histogram in R (Normal, Density, Another Series)
  • Video: R, RStudio, Rcmdr & rattle
  • Getting Started Using R, Part 2: Rcmdr
  • Getting Started Using R, Part 1: RStudio
  • Learning R Has Really Made Me Appreciate SAS