I’ve written several posts about the Adobe Analytics Analytics (née Clickstream) Data Feed (links: 1,2,3) over the past several years. The Analytics Data Feed is an invaluable tool for moving beyond aggregate-level reporting information about your customers to really in-depth, customer-level analytics.
While the Analytics Data Feed is nowhere as easy to use as the Adobe UI, Report Builder, Analytics Workspace or even RSiteCatalyst, the hardest part for me when I was a digital analytics consultant was just obtaining the files in the first place (to say nothing of restarting a failed feed)! Luckily, Adobe has now built an interface accessible by any Adobe Analytics admin, removing the need for ClientCare to set up and maintain feeds.
In this post, I will briefly highlight how to set up an Analytics Data Feed from inside Adobe Analytics and give my impressions of the tool (as it exists at the time of writing). Note this post is not meant to be a substitute to the official documentation; Adobe provides detailed information about the entire process in their Help section.
Landing the Files via FTP/SFTP/S3
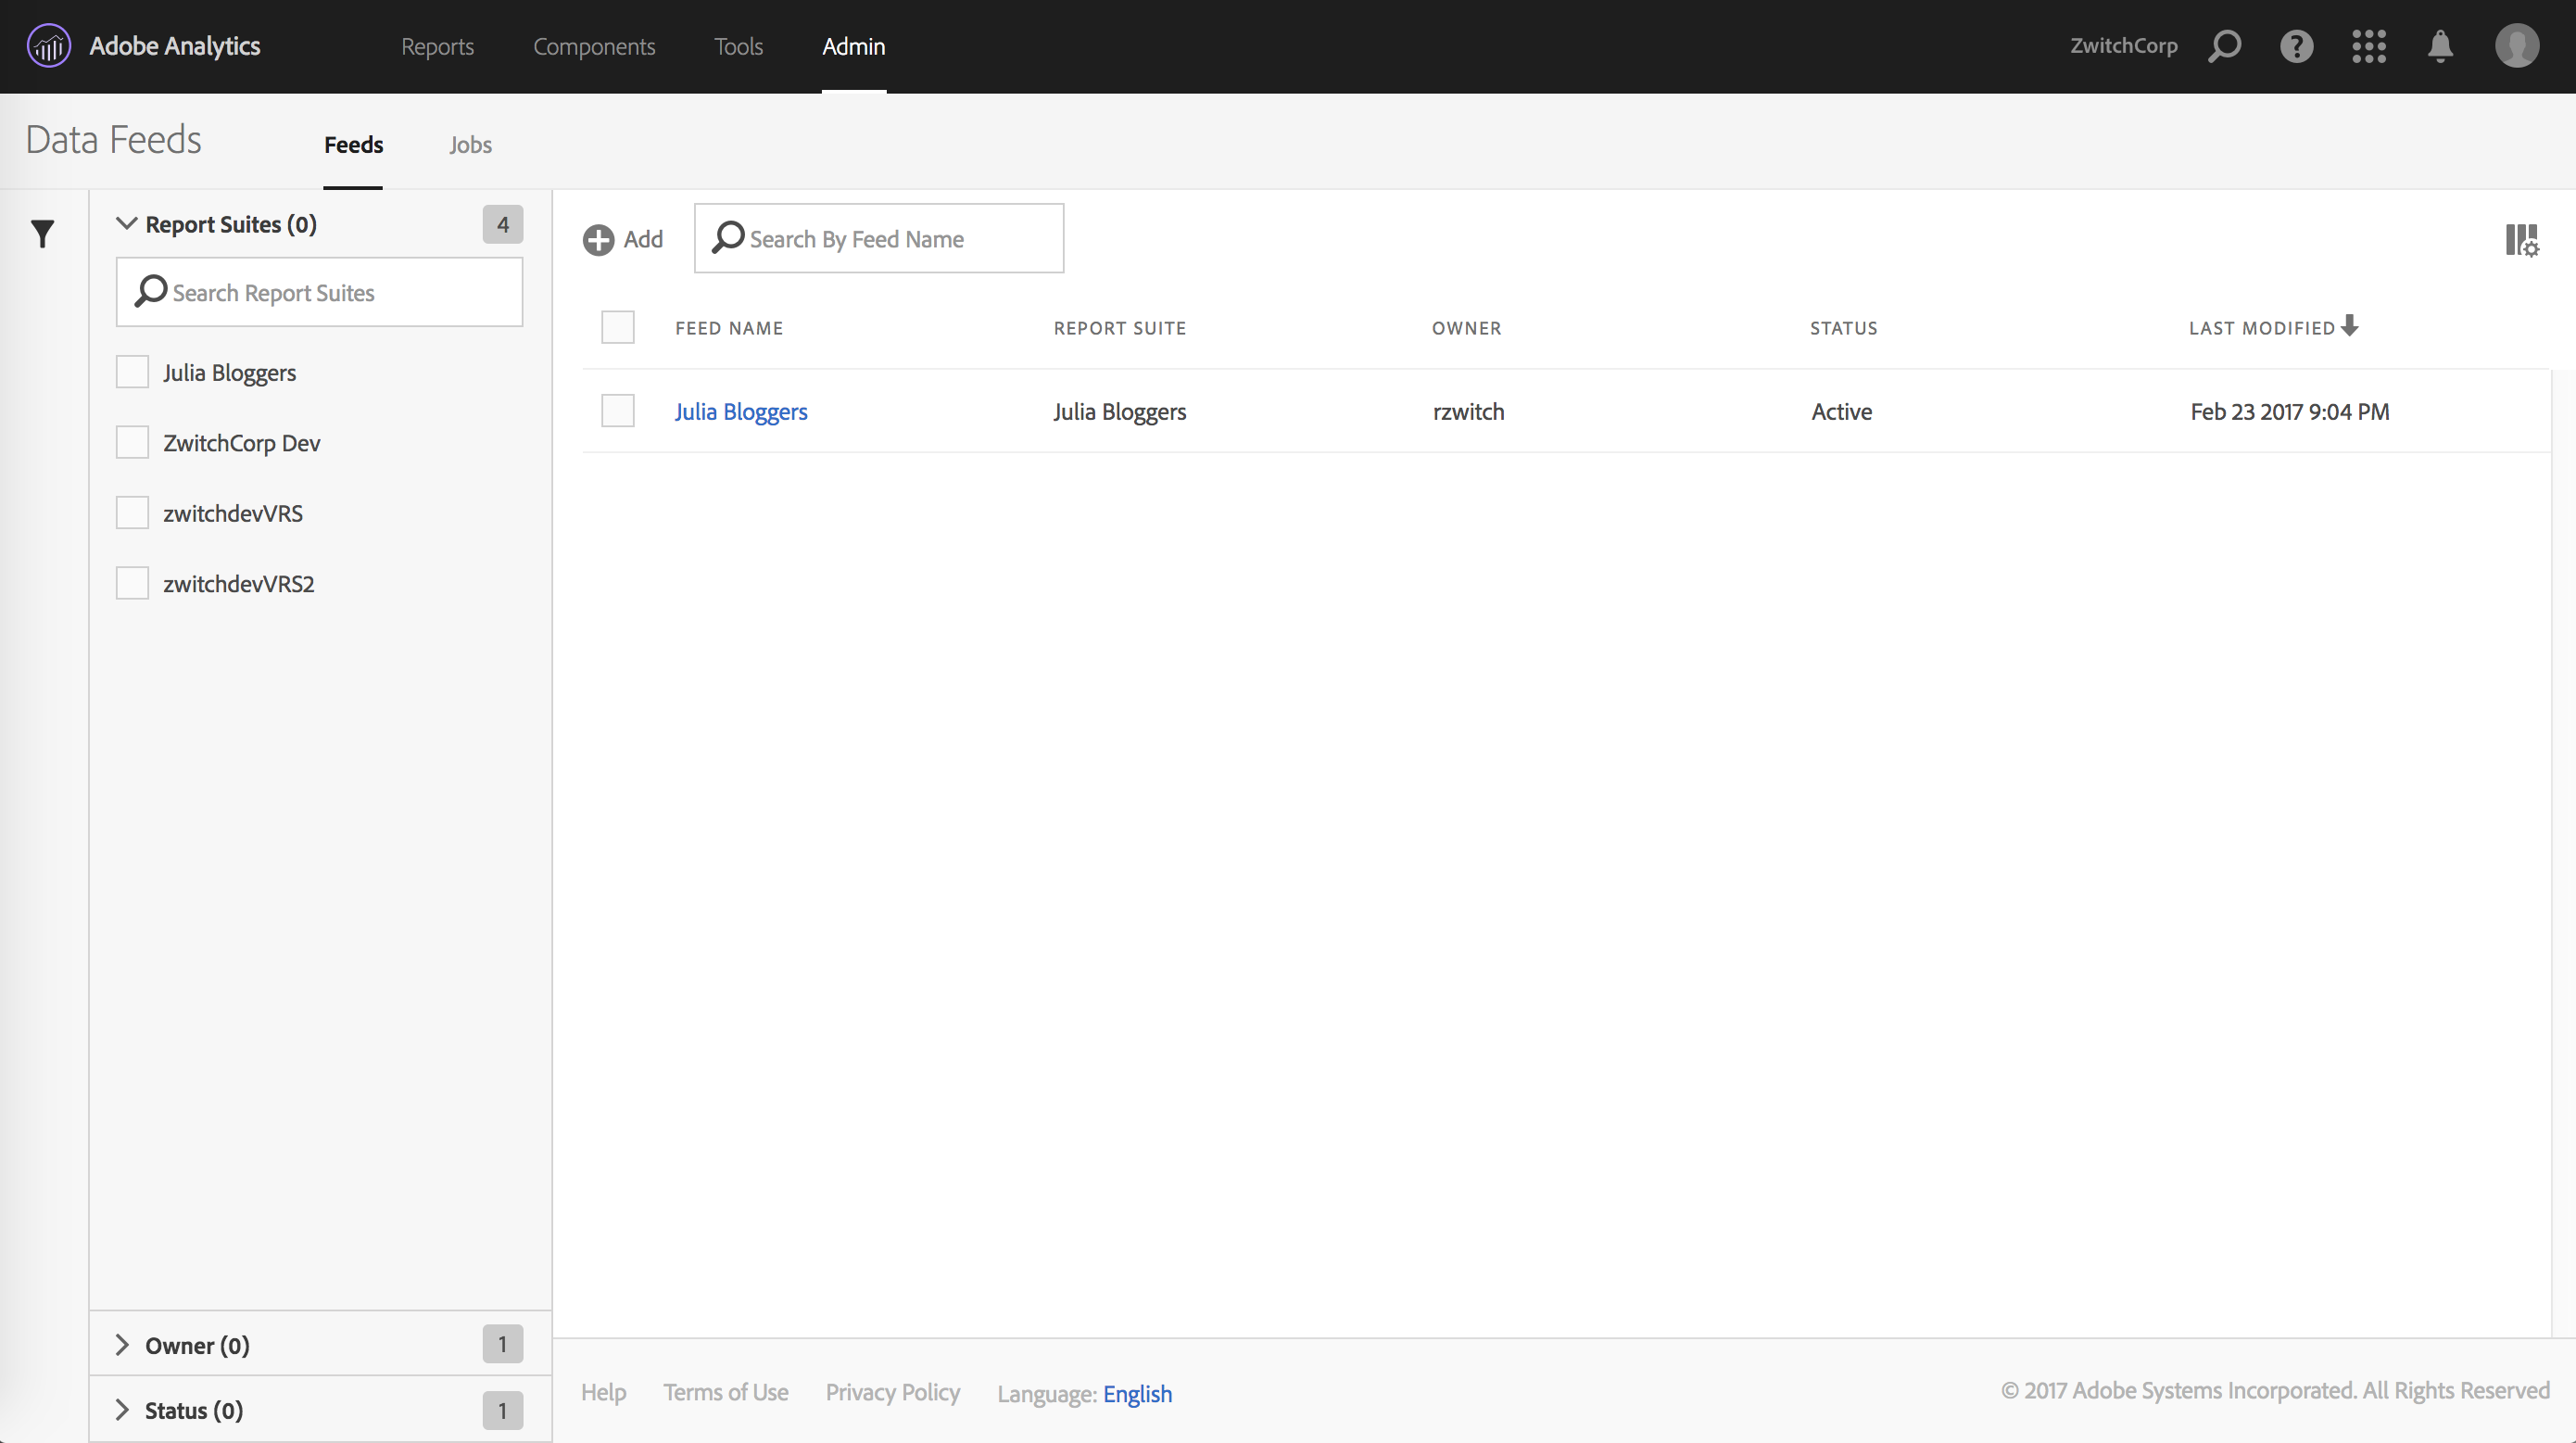
After clicking ‘Admin -> Data Feeds’ in the Adobe Analytics Admin menu/panel, you should see an interface similar to the following:
After clicking the “(+) Add” button, you will be brought to a page with three parts: Feed Information, Delivery Location and Data Column Definitions. The top half of the page looks as follows:
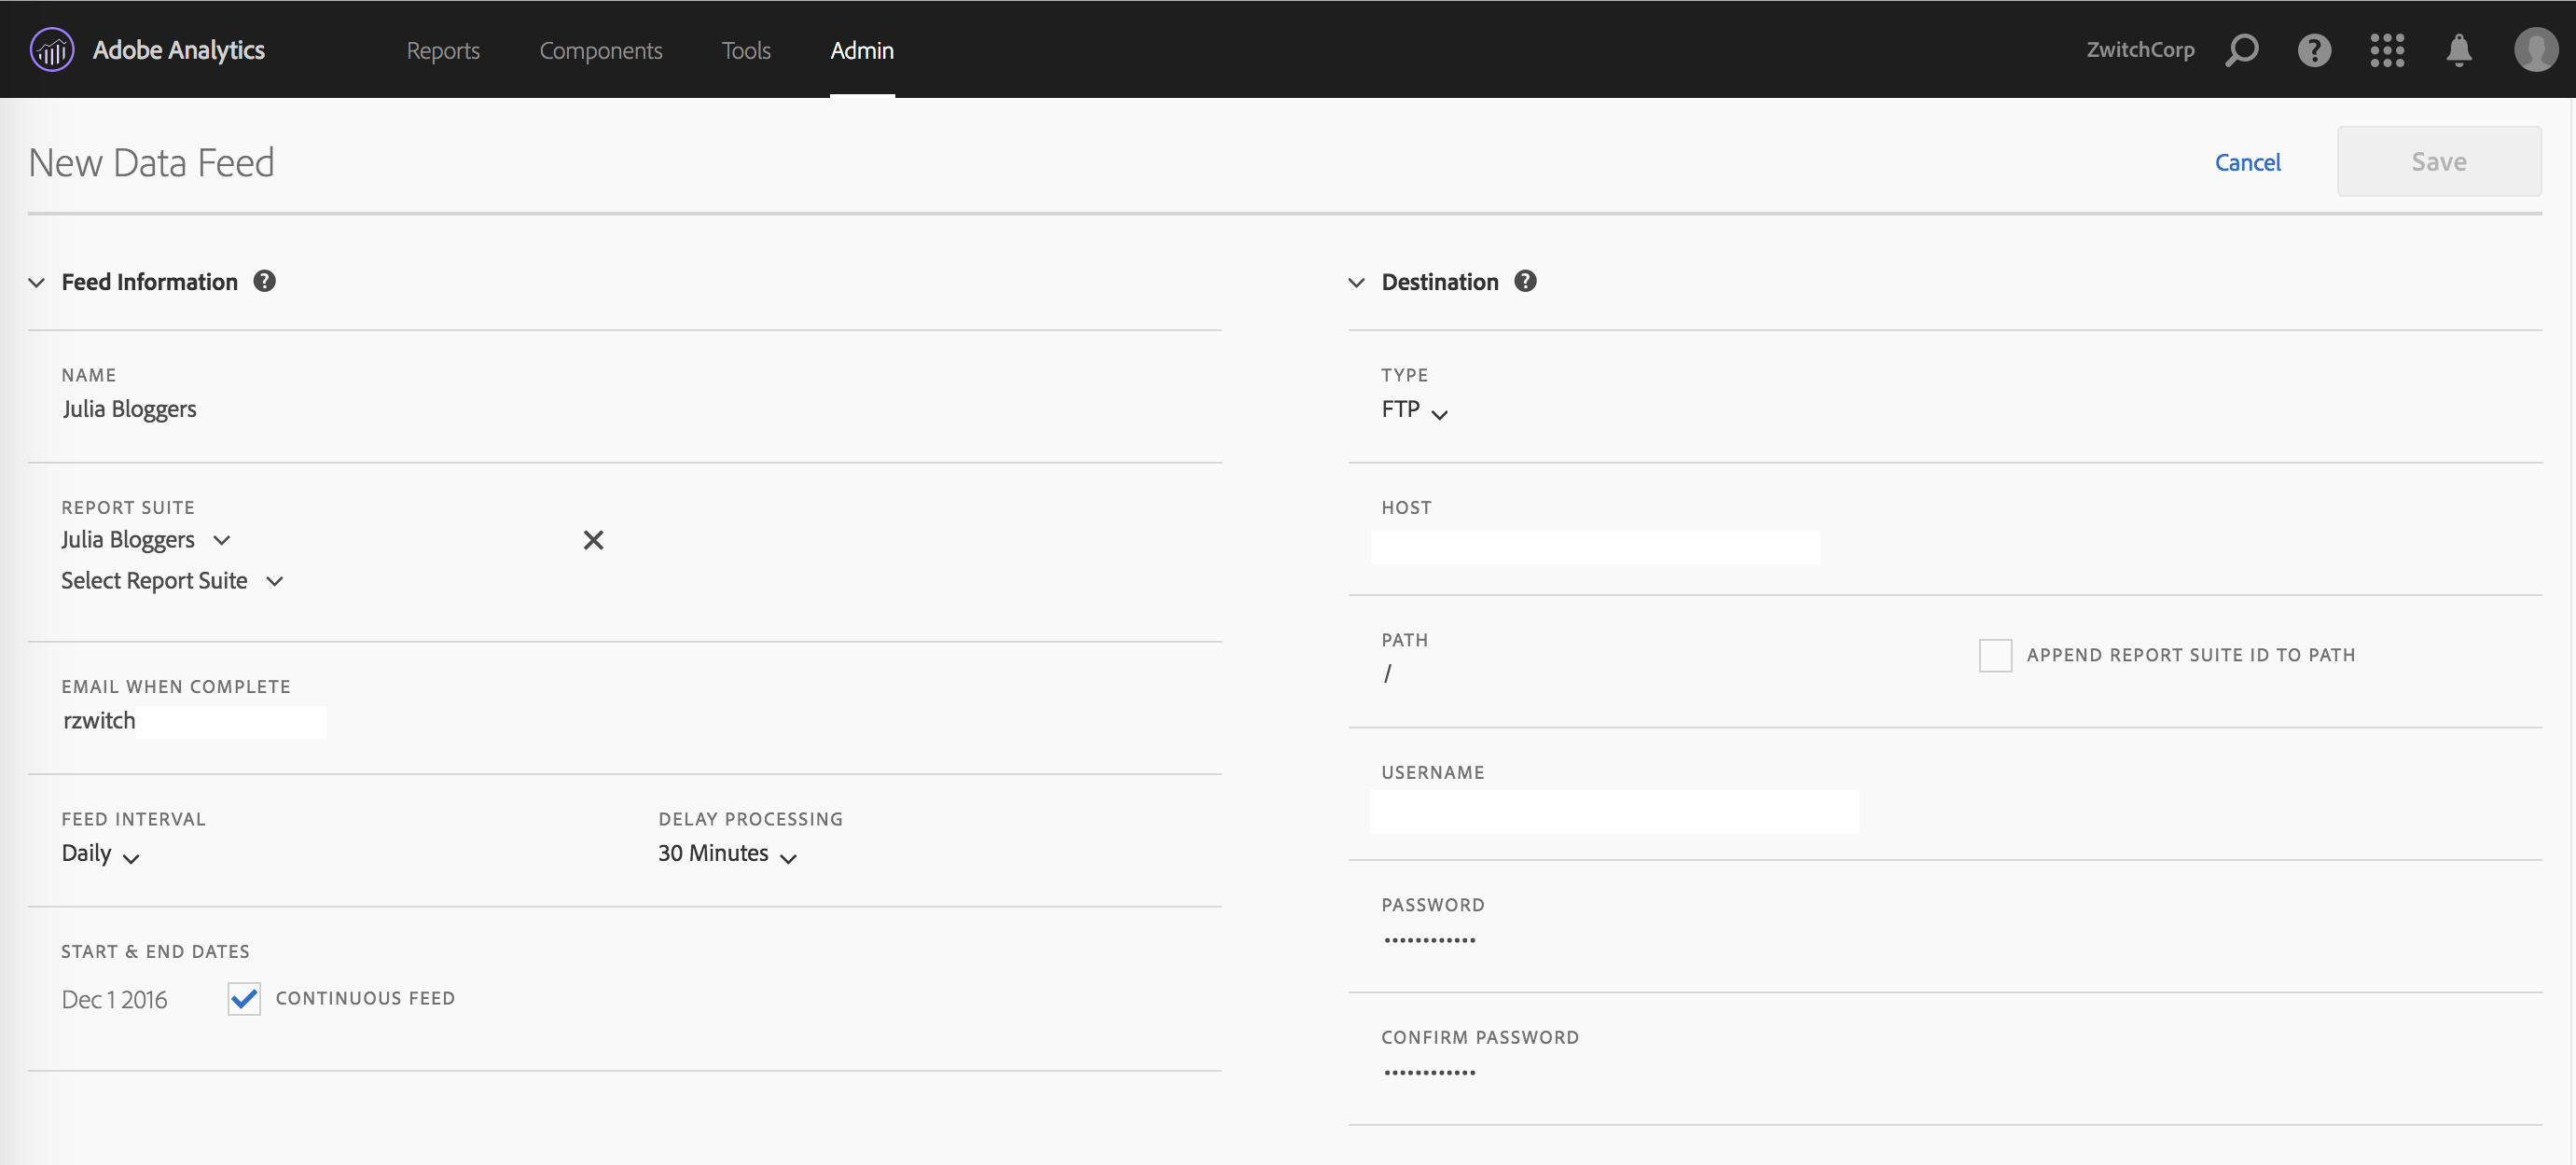
I find these two panels fairly self-explanatory. On the left, you give your data feed a name, choose the report suite(s) you want the data feed for, pick the delivery granularity, then choose the start/end date or choose ‘continuous’ for indefinite future delivery. On the right side, you provide your server information, FTP/SFTP or Amazon S3.
There are several things I love about this setup:
-
Delivery via SFTP and S3: For the longest time, FTP was the only choice, which disappointed security-minded folks who wanted SFTP. With S3 delivery, you can house your data files and read them into Hadoop directly (assuming you use AWS); this means you don’t necessarily have to do anything with the data until you need it, then you can fire up an EMR job to get your data. Dump the cluster when you’re done. Nice.
-
Multiple Report Suites, same window: I’m so happy to see that this interface supports choosing multiple report suites within the same “feed”. This makes it so much easier than having to create a separate feed instance, when in many cases the settings will stay the same (other than report suite of course).
What I don’t love:
- Not saving FTP information: When you do choose to create separate feeds, there doesn’t appear to be a way to use the same credentials without typing them in yourself. Not a huge deal if your password is “Mom”, a little more annoying if you auto-generate a password that looks like “aHR0cDovL3JhbmR5endpdGNoLmNvbQ==”
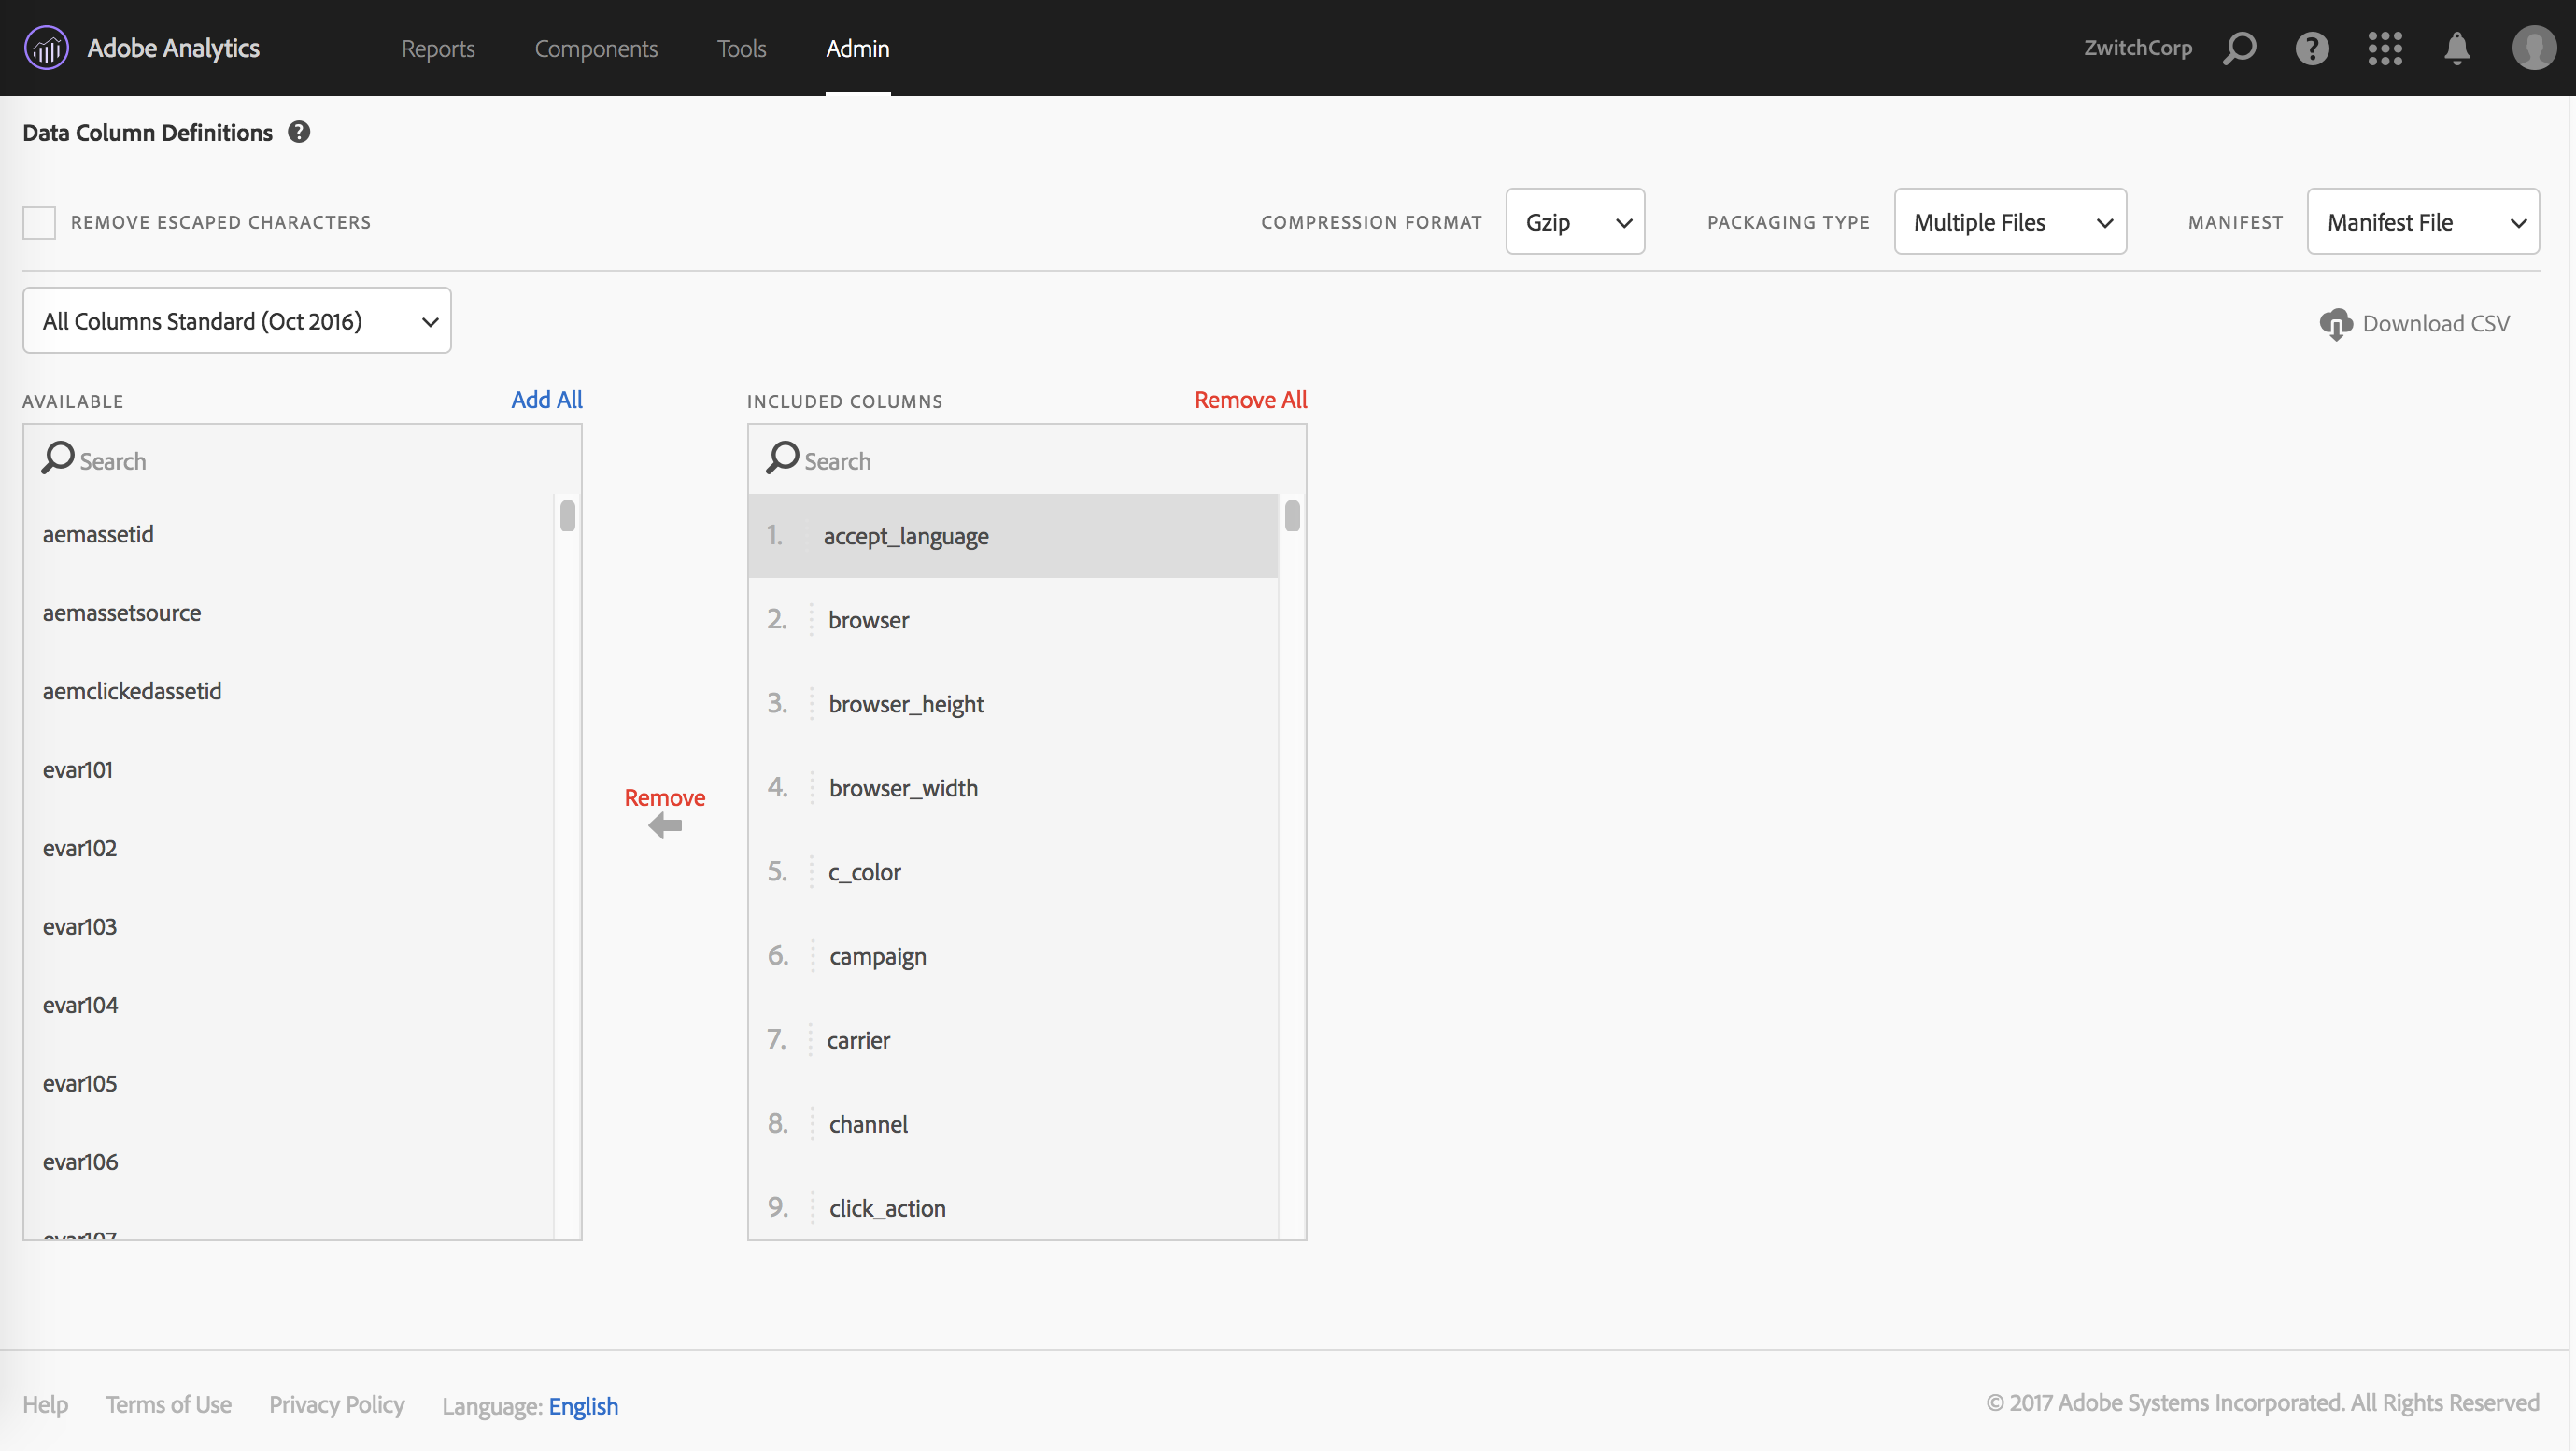
Data Column Definitions
After choosing the report suites and providing the delivery details, the remaining step is to decide which data fields you want as part of the data feed. Luckily, there are templates that can be chosen, so that the user doesn’t have to remember every single field and the order that they need.
My favored practice when working with the data feeds is to have every feed have the same structure, even if certain report suites don’t have nearly the same amount of eVars and props implemented. I’m of the mind that taking all the fields, then letting the ETL process handle what to do with the data is much less error-prone. You can always re-run an ETL process if you forgot something; if you forget a column in your data feed, you need to re-process all of the feeds.
Empty columns are also much less wasteful in the age of distributed computing (such as Hadoop), as columnar data formats/databases remove much of the performance penalty of empty columns. Using dictionary encoding and columnar data structures, you can represent an entire column of missing values as {NA:
Save and Repeat
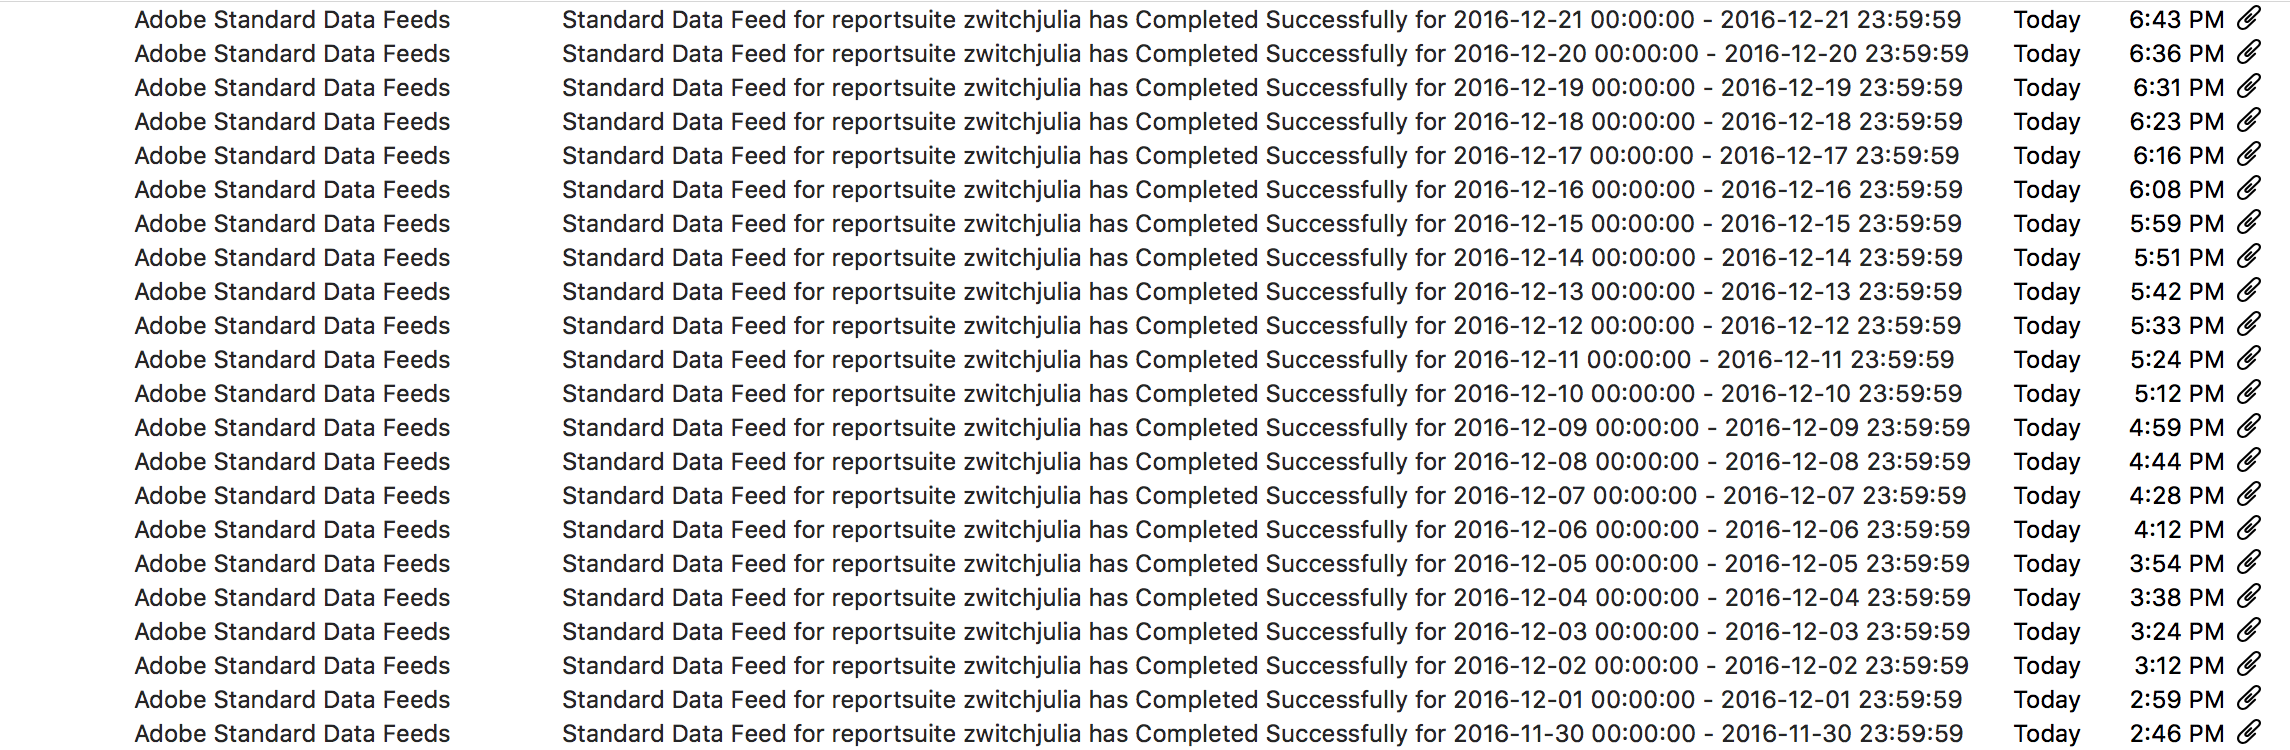
Once you have your data feed defined, you save your work and that’s it! I’m not sure what SLA might be in place, but it seems like there’s roughly a 48-hour delay between submitting a new feed and having the data start to process. Once the processing starts, your notification inbox will quickly look like this:
Automated Monitoring with RSiteCatalyst
If you want to have more control around monitoring than just staring at your inbox, you can use RSiteCatalyst to get the processing status of your feed:
1
2
3
4
5
6
7
8
9
10
library(RSiteCatalyst)

#Authentication (assumes credentials saved in .Renviron)
SCAuth(Sys.getenv("USER", ""), Sys.getenv("SECRET", ""))

#Get full list of report suites
rs <- GetReportSuites()

#Pass in all non-virtual report suites
feedstatus <- GetFeeds(rs[is.na(rs$virtual), ]$rsid)
GetFeeds will return a dataframe that returns the feed information, as well as the processing status:
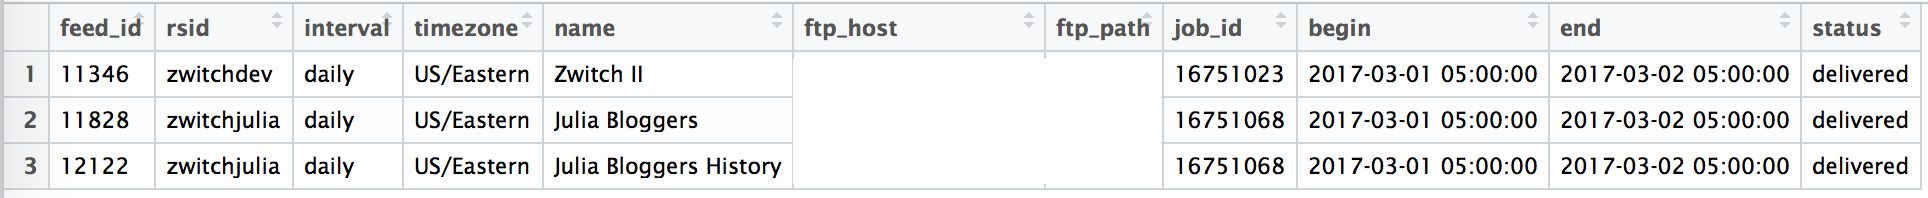
It’s not hard to imagine what a cronjob would look like, polling the Adobe API every few minutes to see which feeds are complete, then kicking off an ETL process.
Data, Liberated!
This blog post has been relatively light on code and analysis, but I hope I’ve highlighted that the barriers to obtaining the most granular data Adobe can provide have been completely removed. With the new Analytics Data Feed interface, the possibility of bespoke customer analytics is only a few button clicks and an FTP away.