Using Omniture SiteCatalyst Target Report To Calculate YOY growth

Of the hundreds of stock reports and capabilities present within Adobe (Omniture) SiteCatalyst, calculating year-over-year growth isn’t the easiest thing to do.  And while conversion reports (eVars) have the “Compare Dates” functionality within the calendar menu, we can’t quickly plot the difference between two time periods within a dashboard.  This is where the Omniture SiteCatalyst Target report comes in handy.

Setting up your “Goal”

Within the Omniture Knowledge Base KB2153, I think Omniture does a disservice by stating:

Targets are quantifiable goals that you can place within the SiteCatalyst interface and compare against reports.

While this is a true statement, I think one of the reasons that the Omniture SiteCatalyst Target report isn’t more widely used is that it doesn’t have to be a future “goal” per se, any set numbers can be used.  When last year’s numbers are used, the report becomes a year-over-year comparison!

For this example, I’m going to be comparing page views year-over-year.  Here’s what the page views summary by month looks like for 2011:

omniture-page-views-report

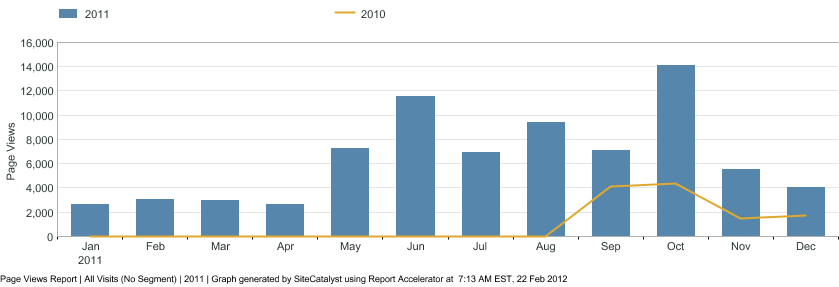
Omniture Page Views Report - 2011

Using this report to set a year-over-year target, we can see the early months are in the few thousands of page views, increasing to 12,000 -14,000 later in the year.

Omniture SiteCatalyst Target interface - Inputting our numbers

Screen Shot 2012-02-22 at 7.49.46 AM

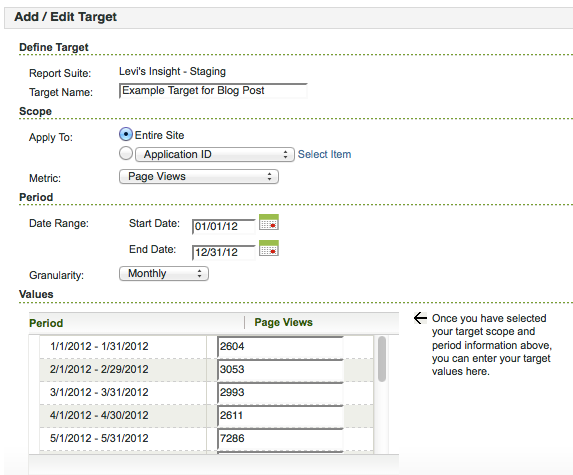
Monthly Target Setup within Omniture Interface

Assuming you are using Omniture SiteCatalyst v15, you set up a Target report under Favorites -> Targets -> Manage Targets, then choose Add New once you’re in the Targets menu.  I’ll be setting up a monthly target for Page Views, so I’ll just type it in instead of using the file upload capability.  For this example, we want to apply this target to “Entire Site” for the “Page Views” Metric.  The date range will be all of 2012, with “Monthly” granularity.  This will give you 12 boxes to type in the 2011 Page View results, and once we hit “Ok” to save, we’ll have our year-over-year report set up.

Getting the Year-over-Year graph within Omniture

Showing the results of our newly created Target report is as easy as going to Favorites -> Targets, then choosing the appropriate Target.  By default, the report will show like a normal metric report, with a green overlay for your targets:

Omniture-target-report-default

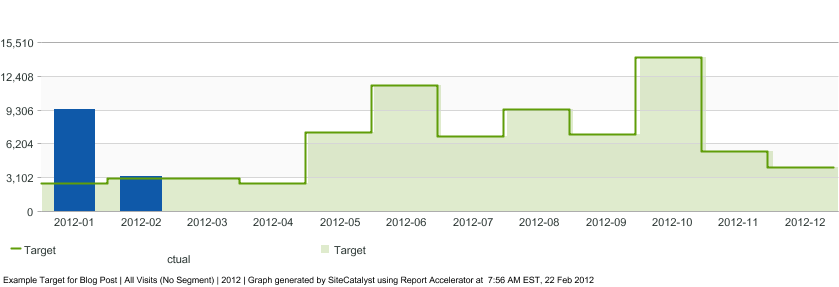
Default view of Omniture SiteCatalyst Target report

The above report shows that Page Views for January 2012 are well above our January 2011 “Target” and that February has already exceeded the goal as well…which is great since we’ve got 7 more days left in the month!

If we want to show the year-over-year delta, however, we can choose the “Variance” report option at the top of the graph.  Doing so will show the following report:

omniture-target-variance

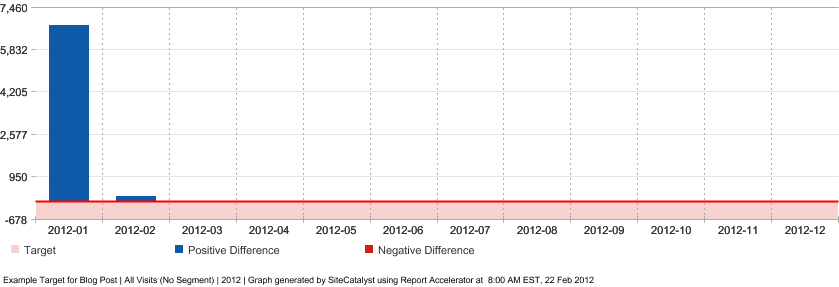
Omniture SiteCatalyst Target Report - "Variance" option

By placing this report in a dashboard, we can quickly evaluate whether Page Views have grown by month year-over-year.  It’s disappointing that the only graph option Adobe provides is the raw metric higher/lower than the target instead of a percentage difference view, but the percentage difference is calculated as part of the data table view that goes along with this report.

Conclusion

When talking about “growth” many businesses aren’t content with just year-over-year growth, usually aiming for 10%, 20%…10,000% growth.  These are goals that work well to track within the Omniture SiteCatalyst Target report.  But year-over-year growth can be worth monitoring too, and the Omniture SiteCatalyst Target report is a great way to do so.

  • RSiteCatalyst Version 1.4.16 Release Notes
  • Using RSiteCatalyst With Microsoft PowerBI Desktop
  • RSiteCatalyst Version 1.4.14 Release Notes
  • RSiteCatalyst Version 1.4.13 Release Notes
  • RSiteCatalyst Version 1.4.12 (and 1.4.11) Release Notes
  • Self-Service Adobe Analytics Data Feeds!
  • RSiteCatalyst Version 1.4.10 Release Notes
  • WordPress to Jekyll: A 30x Speedup
  • Bulk Downloading Adobe Analytics Data
  • Adobe Analytics Clickstream Data Feed: Calculations and Outlier Analysis
  • Adobe: Give Credit. You DID NOT Write RSiteCatalyst.
  • RSiteCatalyst Version 1.4.8 Release Notes
  • Adobe Analytics Clickstream Data Feed: Loading To Relational Database
  • Calling RSiteCatalyst From Python
  • RSiteCatalyst Version 1.4.7 (and 1.4.6.) Release Notes
  • RSiteCatalyst Version 1.4.5 Release Notes
  • Getting Started: Adobe Analytics Clickstream Data Feed
  • RSiteCatalyst Version 1.4.4 Release Notes
  • RSiteCatalyst Version 1.4.3 Release Notes
  • RSiteCatalyst Version 1.4.2 Release Notes
  • Destroy Your Data Using Excel With This One Weird Trick!
  • RSiteCatalyst Version 1.4.1 Release Notes
  • Visualizing Website Pathing With Sankey Charts
  • Visualizing Website Structure With Network Graphs
  • RSiteCatalyst Version 1.4 Release Notes
  • Maybe I Don't Really Know R After All
  • Building JSON in R: Three Methods
  • Real-time Reporting with the Adobe Analytics API
  • RSiteCatalyst Version 1.3 Release Notes
  • Adobe Analytics Implementation Documentation in 60 Seconds
  • RSiteCatalyst Version 1.2 Release Notes
  • Clustering Search Keywords Using K-Means Clustering
  • RSiteCatalyst Version 1.1 Release Notes
  • Anomaly Detection Using The Adobe Analytics API
  • (not provided): Using R and the Google Analytics API
  • My Top 20 Least Useful Omniture Reports
  • For Maximum User Understanding, Customize the SiteCatalyst Menu
  • Effect Of Modified Bounce Rate In Google Analytics
  • Adobe Discover 3: First Impressions
  • Using Omniture SiteCatalyst Target Report To Calculate YOY growth
  • ODSC webinar: End-to-End Data Science Without Leaving the GPU
  • PyData NYC 2018: End-to-End Data Science Without Leaving the GPU
  • Data Science Without Leaving the GPU
  • Getting Started With OmniSci, Part 2: Electricity Dataset
  • Getting Started With OmniSci, Part 1: Docker Install and Loading Data
  • Parallelizing Distance Calculations Using A GPU With CUDAnative.jl
  • Building a Data Science Workstation (2017)
  • JuliaCon 2015: Everyday Analytics and Visualization (video)
  • Vega.jl, Rebooted
  • Sessionizing Log Data Using data.table [Follow-up #2]
  • Sessionizing Log Data Using dplyr [Follow-up]
  • Sessionizing Log Data Using SQL
  • Review: Data Science at the Command Line
  • Introducing Twitter.jl
  • Code Refactoring Using Metaprogramming
  • Evaluating BreakoutDetection
  • Creating A Stacked Bar Chart in Seaborn
  • Visualizing Analytics Languages With VennEuler.jl
  • String Interpolation for Fun and Profit
  • Using Julia As A "Glue" Language
  • Five Hard-Won Lessons Using Hive
  • Using SQL Workbench with Apache Hive
  • Getting Started With Hadoop, Final: Analysis Using Hive & Pig
  • Quickly Create Dummy Variables in a Data Frame
  • Using Amazon EC2 with IPython Notebook
  • Adding Line Numbers in IPython/Jupyter Notebooks
  • Fun With Just-In-Time Compiling: Julia, Python, R and pqR
  • Getting Started Using Hadoop, Part 4: Creating Tables With Hive
  • Tabular Data I/O in Julia
  • Hadoop Streaming with Amazon Elastic MapReduce, Python and mrjob
  • A Beginner's Look at Julia
  • Getting Started Using Hadoop, Part 3: Loading Data
  • Innovation Will Never Be At The Push Of A Button
  • Getting Started Using Hadoop, Part 2: Building a Cluster
  • Getting Started Using Hadoop, Part 1: Intro
  • Instructions for Installing & Using R on Amazon EC2
  • Video: SQL Queries in R using sqldf
  • Video: Overlay Histogram in R (Normal, Density, Another Series)
  • Video: R, RStudio, Rcmdr & rattle
  • Getting Started Using R, Part 2: Rcmdr
  • Getting Started Using R, Part 1: RStudio
  • Learning R Has Really Made Me Appreciate SAS