Getting Started With Hadoop, Final: Analysis Using Hive & Pig

We’ve finally made it to the final post in this tutorial! In my prior posts about getting started with Hadoop, we’ve covered the entire lifecycle from how to set up a small cluster using Amazon EC2 and Cloudera through how to load data using Hue. With our data loaded in HDFS, we can finally move on to the actual analysis portion of the airline dataset using Hive and Pig.

Basic Descriptive Statistics Using Hive

In part 4 of this tutorial, we used a Hive script to create a view named “vw_airline” to hold all of our airline data. Running a simple query is as easy as running the following in the Hive window in Hue. Note that this is ANSI-standard SQL code, even though we are submitting it using Hive:

simple-hive-query"

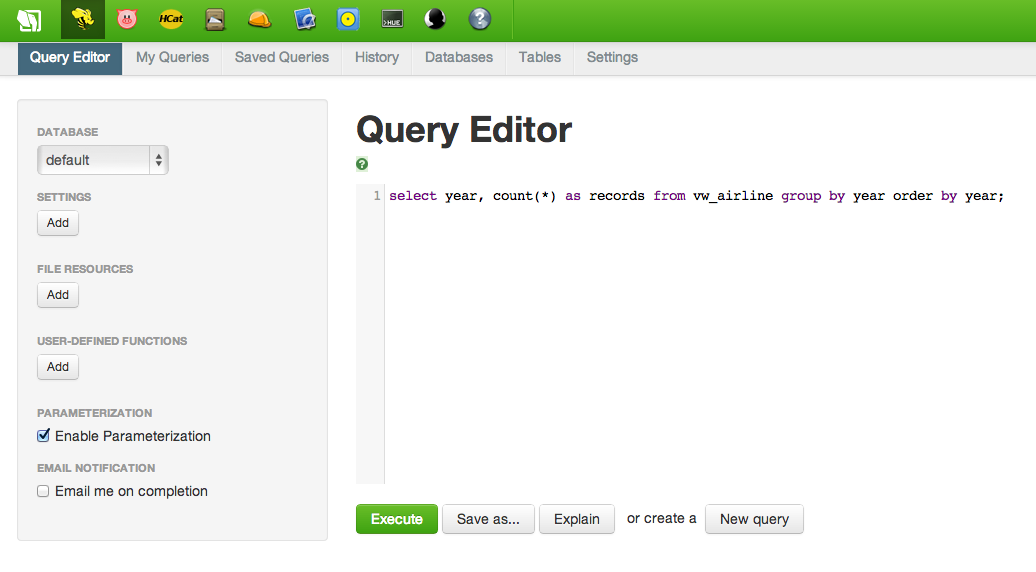
A simple query like this is a great way to get a feel for the table, including determining whether or not the files were loaded correctly. Once the results are displayed, you can create simple visualizations like bar charts, line plots, scatterplots and pie charts. The results of the following query are shown below. Knowing this dataset, I can tell that the files were loaded incorrectly; the dips at Years 1994 and 2004 are too few records and will need to be reloaded.

hive-visualization-results

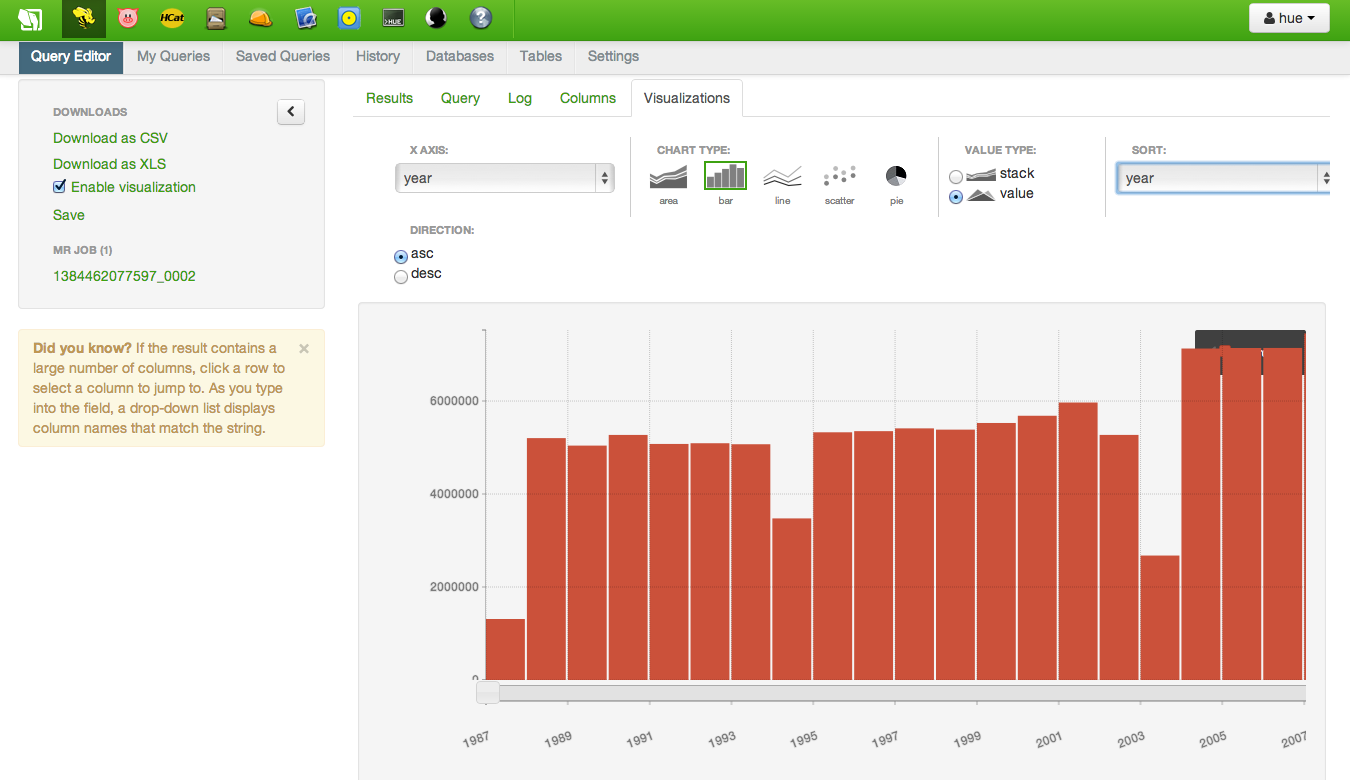
1994 and 2004 have too few rows, which was validated using wc -l 1994.csv at the command line (outside of Hadoop)

Besides just simple counts, Hive supports nearly all standard SQL syntax relative to functions such as SUM, COUNT, MIN, MAX, etc., table joins, user-defined functions (UDF)`, window functions…pretty much everything that you are used to from other SQL tools.  AFAIK, the only thing that Hive doesn’t support is nested sub-queries, but that’s on the Stinger initiative for improving Hive. However, depending on the nested subquery being performed, you might be able to accomplish the same thing using a LEFT SEMI JOIN.

Using Pig for Analytics

It’s important to realize that Hadoop isn’t just another RDBMS where you run SQL. Using Pig, you can write scripts for calculation in a similar manner to using other high-level languages such as Python or R.

For example, suppose we wanted to calculate the average distance for each route. A Pig script to calculate this might look like the following:

1
2
3
4
5
6
7
8
9
10
11
12
13
14
15
16
17
18
19
--Load data from view to use
air = LOAD 'default.vw_airline' USING org.apache.hcatalog.pig.HCatLoader();

--Use FOREACH to limit data to origin, dest, distance
--Concatentate origin and destination together, separated by a pipe
--CONCAT appears to only allow two arguments, which is why the function is called twice (to allow 3 arguments)
origindest = FOREACH air generate CONCAT(origin, CONCAT('|' , dest)) as route, distance;

--Group origindest dataset by route
groupedroutes = GROUP origindest BY (route);

--Calculate average distance by route
avg_distance = FOREACH groupedroutes GENERATE group, AVG(origindest.distance);

--Show results in Pig shell
dump avg_distance;

--Write out results to text file, separated by tab (default)
store avg_distance into '/user/hue/avg_distance';

While it is possible to calculate average distance using Hive and a GROUP BY statement, one of the benefits to using Pig is having control over every step of the data flow. So while Hive queries tend to answer a single question at a time, Pig allows an analyst to chain together any number of steps in a data flow. In the example above, we could pass the average distance for each route to another transformation, join it back to the original dataset or do anything else our analyst minds can imagine!

Summary

Over these five blog posts, I’ve outlined how to get started with Hadoop and ‘Big Data’ using Amazon and Cloudera/Hortonworks. Hopefully I’ve been able to demystify the concepts and terminology behind Hadoop, shown that setting up a Hadoop using Cloudera on Amazon EC2 isn’t unsurmountable, and loading data and analyzing it using Hive and Pig isn’t dramatically different than using SQL on other database systems you may have encountered in the past.

While there’s a lot of hype around ‘Big Data’, data sizes aren’t going to be getting any smaller in the future. So spend the $20 in AWS charges and build a Hadoop cluster! There’s no better way to learn than by doing…

  • RSiteCatalyst Version 1.4.16 Release Notes
  • Using RSiteCatalyst With Microsoft PowerBI Desktop
  • RSiteCatalyst Version 1.4.14 Release Notes
  • RSiteCatalyst Version 1.4.13 Release Notes
  • RSiteCatalyst Version 1.4.12 (and 1.4.11) Release Notes
  • Self-Service Adobe Analytics Data Feeds!
  • RSiteCatalyst Version 1.4.10 Release Notes
  • WordPress to Jekyll: A 30x Speedup
  • Bulk Downloading Adobe Analytics Data
  • Adobe Analytics Clickstream Data Feed: Calculations and Outlier Analysis
  • Adobe: Give Credit. You DID NOT Write RSiteCatalyst.
  • RSiteCatalyst Version 1.4.8 Release Notes
  • Adobe Analytics Clickstream Data Feed: Loading To Relational Database
  • Calling RSiteCatalyst From Python
  • RSiteCatalyst Version 1.4.7 (and 1.4.6.) Release Notes
  • RSiteCatalyst Version 1.4.5 Release Notes
  • Getting Started: Adobe Analytics Clickstream Data Feed
  • RSiteCatalyst Version 1.4.4 Release Notes
  • RSiteCatalyst Version 1.4.3 Release Notes
  • RSiteCatalyst Version 1.4.2 Release Notes
  • Destroy Your Data Using Excel With This One Weird Trick!
  • RSiteCatalyst Version 1.4.1 Release Notes
  • Visualizing Website Pathing With Sankey Charts
  • Visualizing Website Structure With Network Graphs
  • RSiteCatalyst Version 1.4 Release Notes
  • Maybe I Don't Really Know R After All
  • Building JSON in R: Three Methods
  • Real-time Reporting with the Adobe Analytics API
  • RSiteCatalyst Version 1.3 Release Notes
  • Adobe Analytics Implementation Documentation in 60 Seconds
  • RSiteCatalyst Version 1.2 Release Notes
  • Clustering Search Keywords Using K-Means Clustering
  • RSiteCatalyst Version 1.1 Release Notes
  • Anomaly Detection Using The Adobe Analytics API
  • (not provided): Using R and the Google Analytics API
  • My Top 20 Least Useful Omniture Reports
  • For Maximum User Understanding, Customize the SiteCatalyst Menu
  • Effect Of Modified Bounce Rate In Google Analytics
  • Adobe Discover 3: First Impressions
  • Using Omniture SiteCatalyst Target Report To Calculate YOY growth
  • ODSC webinar: End-to-End Data Science Without Leaving the GPU
  • PyData NYC 2018: End-to-End Data Science Without Leaving the GPU
  • Data Science Without Leaving the GPU
  • Getting Started With OmniSci, Part 2: Electricity Dataset
  • Getting Started With OmniSci, Part 1: Docker Install and Loading Data
  • Parallelizing Distance Calculations Using A GPU With CUDAnative.jl
  • Building a Data Science Workstation (2017)
  • JuliaCon 2015: Everyday Analytics and Visualization (video)
  • Vega.jl, Rebooted
  • Sessionizing Log Data Using data.table [Follow-up #2]
  • Sessionizing Log Data Using dplyr [Follow-up]
  • Sessionizing Log Data Using SQL
  • Review: Data Science at the Command Line
  • Introducing Twitter.jl
  • Code Refactoring Using Metaprogramming
  • Evaluating BreakoutDetection
  • Creating A Stacked Bar Chart in Seaborn
  • Visualizing Analytics Languages With VennEuler.jl
  • String Interpolation for Fun and Profit
  • Using Julia As A "Glue" Language
  • Five Hard-Won Lessons Using Hive
  • Using SQL Workbench with Apache Hive
  • Getting Started With Hadoop, Final: Analysis Using Hive & Pig
  • Quickly Create Dummy Variables in a Data Frame
  • Using Amazon EC2 with IPython Notebook
  • Adding Line Numbers in IPython/Jupyter Notebooks
  • Fun With Just-In-Time Compiling: Julia, Python, R and pqR
  • Getting Started Using Hadoop, Part 4: Creating Tables With Hive
  • Tabular Data I/O in Julia
  • Hadoop Streaming with Amazon Elastic MapReduce, Python and mrjob
  • A Beginner's Look at Julia
  • Getting Started Using Hadoop, Part 3: Loading Data
  • Innovation Will Never Be At The Push Of A Button
  • Getting Started Using Hadoop, Part 2: Building a Cluster
  • Getting Started Using Hadoop, Part 1: Intro
  • Instructions for Installing & Using R on Amazon EC2
  • Video: SQL Queries in R using sqldf
  • Video: Overlay Histogram in R (Normal, Density, Another Series)
  • Video: R, RStudio, Rcmdr & rattle
  • Getting Started Using R, Part 2: Rcmdr
  • Getting Started Using R, Part 1: RStudio
  • Learning R Has Really Made Me Appreciate SAS