Using pandas and pymapd for ETL into OmniSci

I’ve got PyData NYC 2018 in two days and rather finishing up my talk, I just realized that my source data has a silent corruption due to non-standard timestamps. Here’s how I fixed this using pandas and then uploaded the data to OmniSci.

Computers Are Dumb, MAKE THINGS EASIER FOR THEM!

Literally every data tool in the world can read the ISO-8601 timestamp format. Conversely, not every tool in the world can read Excel or whatever horrible other tool people use to generate the CSV files seen in the wild. While I should’ve been more diligent checking my data ingestion, I didn’t until I created a wonky report…

Let’s take a look at the format that tripped me up:

Excel data format sucks

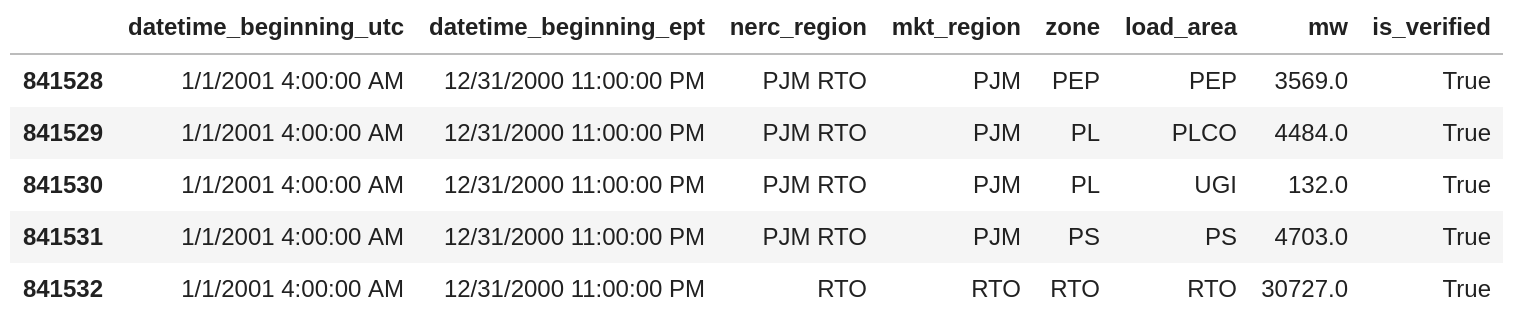
Month/Day/Year Hour:Minute:Second AM/PM feels very much like an Excel date format that you get when Excel is used as a display medium. Unfortunately, when you write CSV files like this, the next tool to read them has to understand 1) that these columns are timestamps and 2) if the user doesn’t specify the format, has to guess the format.

In my case, I didn’t do descriptive statistics on my timestamp columns and had a silent truncation(!) of the AM/PM portion of the data. So instead of having 24 hours in the day, the parser read the data as follows (the #AM and #PM are my comments for clarity):

datetime_beginning_utc
2001-01-01 01:00:00 #AM
2001-01-01 01:00:00 #PM
2001-01-01 02:00:00 #AM
2001-01-01 02:00:00 #PM
2001-01-01 03:00:00 #AM
2001-01-01 03:00:00 #PM
2001-01-01 04:00:00 #AM
2001-01-01 04:00:00 #PM
2001-01-01 05:00:00 #AM
2001-01-01 05:00:00 #PM
2001-01-01 06:00:00 #AM
2001-01-01 06:00:00 #PM
2001-01-01 07:00:00 #AM
2001-01-01 07:00:00 #PM
2001-01-01 08:00:00 #AM
2001-01-01 08:00:00 #PM
2001-01-01 09:00:00 #AM
2001-01-01 09:00:00 #PM
2001-01-01 10:00:00 #AM
2001-01-01 10:00:00 #PM
2001-01-01 11:00:00 #AM
2001-01-01 11:00:00 #PM
2001-01-01 12:00:00 #AM
2001-01-01 12:00:00 #PM

So while the data looks like it was imported correctly (because, it is a timestamp), it wasn’t until I realized that hours 13-23 were missing from my data that I realized I had an error.

Pandas To The Rescue!

Fixing this issue is as straight-forward as reading the CSV into python using pandas and specifying the date format:

import pandas as pd
import datetime
df = pd.read_csv("/mnt/storage1TB/hrl_load_metered/hrl_load_metered.csv",
                 parse_dates=[0,1],
                 date_parser= lambda x: datetime.datetime.strptime(x, "%m/%d/%Y %I:%M:%S %p"))

Yay pandas!

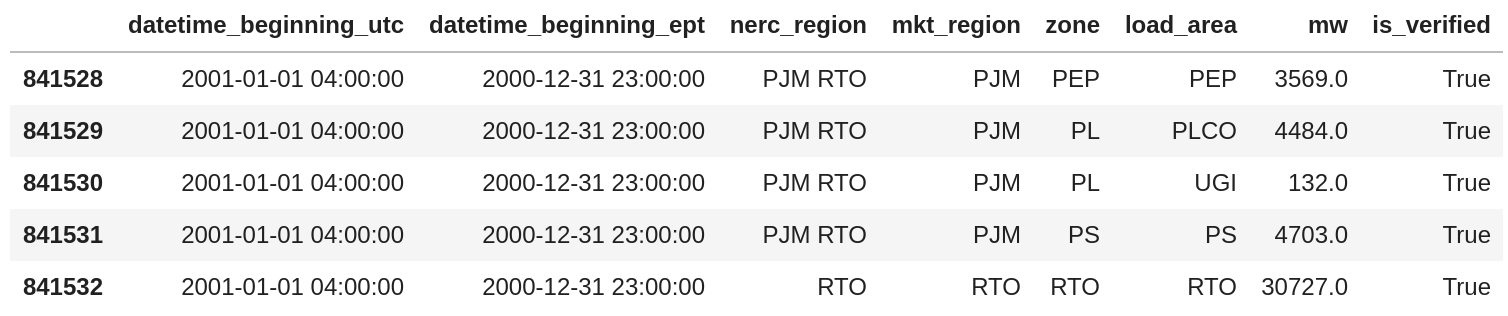
We can see from the code above that pandas has taken our directive about the format and it appears the data have been parsed correctly. A good secondary check here is that the difference in timestamps is -5, which is the offset of the East Coast of the United States relative to UTC.

Uploading to OmniSci Directly From Pandas

Since my PyData talk is going to be using OmniSci, I need to upload this corrected data or rebuild all my work (I’ll opt for fixing my source). Luckily, the pymapd package provides tight integration to an OmniSci database, providing a means of uploading the data directly from a pandas dataframe:

import pymapd

#connect to database
conn = pymapd.connect(host="localhost", port=9091, user="mapd", password="HyperInteractive", dbname="mapd")

#truncate table so that table definition can be reused
conn.execute("truncate table hrl_load_metered")

#re-load data into table
#with none of the optional arguments, pymapd infers that this is an insert operation, since table name exists
conn.load_table_columnar("hrl_load_metered", df)

I have a pre-existing table hrl_load_metered on the database, so I can truncate the table to remove its (incorrect) data but keep the table structure. Then I can use load_table_columnar to insert the cleaned up data into my table and now my data is correct.

Computers May Be Dumb, But Humans Are Lazy

At the beginning, I joked that computers are dumb. Computers are just tools that do exactly what a human programs them to do, and really, it was my laziness that caused this data error. Luckily, I did catch this before my talk and the fix is pretty easy.

I’d like to say I’m going to remember to check my data going forward, but in reality, I’m just documenting this here for the next time I make the same, lazy mistake.

  • RSiteCatalyst Version 1.4.16 Release Notes
  • Using RSiteCatalyst With Microsoft PowerBI Desktop
  • RSiteCatalyst Version 1.4.14 Release Notes
  • RSiteCatalyst Version 1.4.13 Release Notes
  • RSiteCatalyst Version 1.4.12 (and 1.4.11) Release Notes
  • Self-Service Adobe Analytics Data Feeds!
  • RSiteCatalyst Version 1.4.10 Release Notes
  • WordPress to Jekyll: A 30x Speedup
  • Bulk Downloading Adobe Analytics Data
  • Adobe Analytics Clickstream Data Feed: Calculations and Outlier Analysis
  • Adobe: Give Credit. You DID NOT Write RSiteCatalyst.
  • RSiteCatalyst Version 1.4.8 Release Notes
  • Adobe Analytics Clickstream Data Feed: Loading To Relational Database
  • Calling RSiteCatalyst From Python
  • RSiteCatalyst Version 1.4.7 (and 1.4.6.) Release Notes
  • RSiteCatalyst Version 1.4.5 Release Notes
  • Getting Started: Adobe Analytics Clickstream Data Feed
  • RSiteCatalyst Version 1.4.4 Release Notes
  • RSiteCatalyst Version 1.4.3 Release Notes
  • RSiteCatalyst Version 1.4.2 Release Notes
  • Destroy Your Data Using Excel With This One Weird Trick!
  • RSiteCatalyst Version 1.4.1 Release Notes
  • Visualizing Website Pathing With Sankey Charts
  • Visualizing Website Structure With Network Graphs
  • RSiteCatalyst Version 1.4 Release Notes
  • Maybe I Don't Really Know R After All
  • Building JSON in R: Three Methods
  • Real-time Reporting with the Adobe Analytics API
  • RSiteCatalyst Version 1.3 Release Notes
  • Adobe Analytics Implementation Documentation in 60 Seconds
  • RSiteCatalyst Version 1.2 Release Notes
  • Clustering Search Keywords Using K-Means Clustering
  • RSiteCatalyst Version 1.1 Release Notes
  • Anomaly Detection Using The Adobe Analytics API
  • (not provided): Using R and the Google Analytics API
  • My Top 20 Least Useful Omniture Reports
  • For Maximum User Understanding, Customize the SiteCatalyst Menu
  • Effect Of Modified Bounce Rate In Google Analytics
  • Adobe Discover 3: First Impressions
  • Using Omniture SiteCatalyst Target Report To Calculate YOY growth
  • ODSC webinar: End-to-End Data Science Without Leaving the GPU
  • PyData NYC 2018: End-to-End Data Science Without Leaving the GPU
  • Data Science Without Leaving the GPU
  • Getting Started With OmniSci, Part 2: Electricity Dataset
  • Getting Started With OmniSci, Part 1: Docker Install and Loading Data
  • Parallelizing Distance Calculations Using A GPU With CUDAnative.jl
  • Building a Data Science Workstation (2017)
  • JuliaCon 2015: Everyday Analytics and Visualization (video)
  • Vega.jl, Rebooted
  • Sessionizing Log Data Using data.table [Follow-up #2]
  • Sessionizing Log Data Using dplyr [Follow-up]
  • Sessionizing Log Data Using SQL
  • Review: Data Science at the Command Line
  • Introducing Twitter.jl
  • Code Refactoring Using Metaprogramming
  • Evaluating BreakoutDetection
  • Creating A Stacked Bar Chart in Seaborn
  • Visualizing Analytics Languages With VennEuler.jl
  • String Interpolation for Fun and Profit
  • Using Julia As A "Glue" Language
  • Five Hard-Won Lessons Using Hive
  • Using SQL Workbench with Apache Hive
  • Getting Started With Hadoop, Final: Analysis Using Hive & Pig
  • Quickly Create Dummy Variables in a Data Frame
  • Using Amazon EC2 with IPython Notebook
  • Adding Line Numbers in IPython/Jupyter Notebooks
  • Fun With Just-In-Time Compiling: Julia, Python, R and pqR
  • Getting Started Using Hadoop, Part 4: Creating Tables With Hive
  • Tabular Data I/O in Julia
  • Hadoop Streaming with Amazon Elastic MapReduce, Python and mrjob
  • A Beginner's Look at Julia
  • Getting Started Using Hadoop, Part 3: Loading Data
  • Innovation Will Never Be At The Push Of A Button
  • Getting Started Using Hadoop, Part 2: Building a Cluster
  • Getting Started Using Hadoop, Part 1: Intro
  • Instructions for Installing & Using R on Amazon EC2
  • Video: SQL Queries in R using sqldf
  • Video: Overlay Histogram in R (Normal, Density, Another Series)
  • Video: R, RStudio, Rcmdr & rattle
  • Getting Started Using R, Part 2: Rcmdr
  • Getting Started Using R, Part 1: RStudio
  • Learning R Has Really Made Me Appreciate SAS