Recently I’ve been spending a lot of time trying to learn Julia by doing the problems at Project Euler. What’s great about these problems is that it gets me out of my normal design patterns, since I don’t generally think about prime numbers, factorials and other number theory problems during my normal workday. These problems have also given me the opportunity to really think about how computers work, since Julia allows the programmer to pass type declarations to the just-in-time compiler (JIT).
As I’ve been working on optimizing my Julia code, I decided to figure out how fast this problem can be solved using any of the languages/techniques I know. So I decided to benchmark one of the Project Euler problems using Julia, Python, Python with Numba, PyPy, R, R using the compiler package, pqR and pqR using the compiler package. Here’s what I found…
Problem
The problem I’m using for the benchmark is calculating the smallest number that is divisible by all of the numbers in a factorial. For example, for the numbers in 5!, 60 is the smallest number that is divisible by 2, 3, 4 and 5. Here’s the Julia code:
1
2
3
4
5
6
7
8
9
10
11
function smallestdivisall(n::Int64)
    for i = 1:factorial(n)
        for j = 1:n
            if i % j !=0
                break
            elseif j == n
                return i
            end
        end
    end
end
All code versions follow this same pattern: the outside loop will run from 1 up to n!, since by definition the last value in the loop will be divisible by all of the numbers in the factorial. The inner loops go through and do a modulo calculation, checking to see if there is a remainder after division. If there is a remainder, break out of the loop and move to the next number. Once the state occurs where there is no remainder on the modulo calculation and the inner loop value of j equals the last number in the factorial (i.e. it is divisible by all of the factorial numbers), we have found the minimum number.
Benchmarking - Overall
Here are the results of the eight permutations of languages/techniques (see this GitHub Gist for the actual code used, this link for results file, and this GitHub Gist for the ggplot2 code):
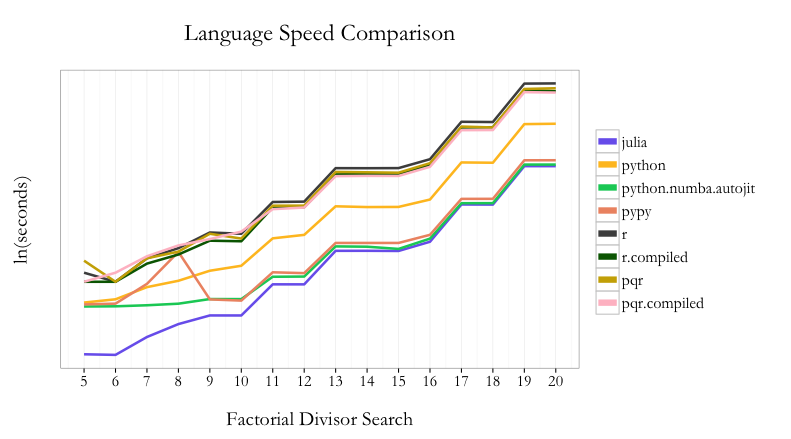
Across the range of tests from 5! to 20!, Julia is the fastest to find the minimum number. Python with Numba is second and PyPy is third. pqR fares better than R in general, but using the compiler package can narrow the gap.
To make more useful comparisons, in the next section I’ll compare each language to its “compiled” function state.
Benchmarking - Individual
Python
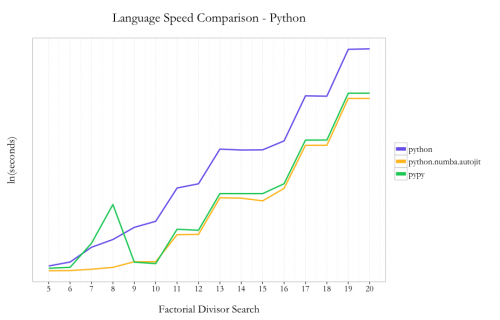
Amongst the native Python code options, I saw a 16x speedup by using PyPy instead of Python 2.7.6 (10.62s vs. 172.06s at 20!). Using Numba with Python instead of PyPy nets an incremental ~40% speedup using the @autojit decorator (7.63s vs. 10.63 at 20!).
So in the case of Python, using two lines of code with the Numba JIT compiler you can get substantial improvements in performance without needing to do any code re-writes. This is a great benefit given that you can stay in native Python, since PyPy doesn’t support all existing packages within the Python ecosystem.
R/pqR
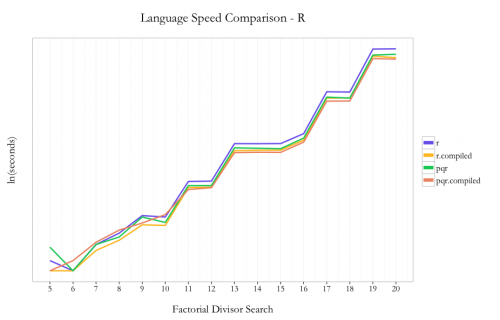
It’s understood in the R community that loops are not a strong point of the language. In the case of this problem, I decided to use loops because 1) it keeps the code pattern similar across languages and 2) I hoped I’d see the max benefit from the compiler package by not trying any funky R optimizations up front.
As expected, pqR is generally faster than R and using the compiler package is faster than not using the compiler. I saw ~30% improvement using pqR relative to R and ~20% incremental improvement using the compiler package with pqR. Using the compiler package within R showed ~35% improvement.
So unlike the case with Python, where you could just use Python with Numba and stay within the same language/environment, if you can use pqR and the compiler package, you can get a performance benefit from using both.
Summary
For a comparison like I’ve done above, it’s easy to get carried away and extrapolate the results from one simple test to all programming problems ever. “Julia is the best language for all cases ever!!!11111eleventy!” would be easy to proclaim, but all problems aren’t looping problems using simple division. Once you get into writing longer programs, other tasks such string manipulation and accessing APIs, using a technique from a package only available in one ecosystem but not another, etc., which tool is “best” for solving a problem becomes a much more difficult decision. The only way to know how much improvement you can see from different techniques & tools is to profile your program(s) and experiment.
The main thing that I took away from this exercise is that no matter which tool you are comfortable with to do analysis, there are potentially large performance improvements that can be made just by using a JIT without needing to dramatically re-write your code. For those of us who don’t know C (and/or are too lazy to re-write our code several times to wring out a little extra performance), that’s a great thing.