Adobe Discover 3: First Impressions

Adobe Discover

With yesterday’s code release, Omniture Adobe released version 3 of their “Discover” tool, THE way to perform web analysis within the Adobe Digital Marketing Suite.  While SiteCatalyst has its place for basic reporting, to really dig deep into your data for actionable insights there’s no substitute to using Discover.

But as with every product overhaul, there is the potential to change things that users liked and while not make enough improvement to excite the user base…but luckily, that’s not the case with Discover 3.  Here’s how I see the new features and design changes.

New “Darth Vader” interface

adobe-discover-3-screenshot

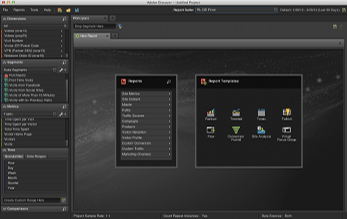
"Ooh, tough looking. Just like hardcore web analysts!"

Of all the cool things about Discover 3, I’m not sure the new color palette is one of them.  Several reasons were given by Adobe for choosing the carbon colored interface, from trying to match analyst’s personalities (yuck!), reducing eye strain (ok), and consistent branding (eh).  Of the three, I’ll say that reducing eye strain is a worthy goal, although Discover 3 never struck me as “eye-burning” in the past.

Maybe I’ll grow to like it, but right now, it seems really dark.  The light gray text on dark gray background needs a bit more contrast, and in general, the interface feels kinda depressing.

Calendars - No more #^%&$ sliders!

Now we’re getting somewhere.  The slider interface in Discover 2 never made sense to me.  You pick your time period up front, open a report, and then to modify the time period within an individual report you needed to move a bunch of jerky sliders around.

In Discover 3, we now have the same style calendar interface as SiteCatalyst.  Makes sense from a consistency standpoint within the Adobe Digital Marketing Suite and a general UX standpoint.  Pointing at two dates on the calendar is way easier and faster than moving endpoints of a slider!

Heterogeneous Pathing

This is so completely badass and the best new feature of Discover 3.  No longer are you confined to a fallout report that only includes just one Omniture variable type.  So if I want to do a funnel that measures visits containing a few different pages, then triggering a Facebook ‘Like’ event, a Cart Open, then an Exit Link, I can now do so!

You can also switch from “Visit-level” to “Visitor-level” on the fly, which can also be useful depending on how your view your business.  Some people like to think about every visit being an opportunity to convert on-site, whereas Avinash advocates in his Web Analytics 2.0 book that using Visitors as the denominator for conversion rate is the proper thought model.  I won’t weigh in on the difference in this post, but it’s cool that we can now change back-and-forth to see what the differences in the data are.

Table Builder

adobe-discover-3-table-builder

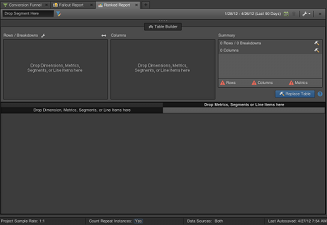
Nice drag-and-drop options, very PivotTable like

Finally, the last really obvious difference between Discover 2 and Discover 3 is the table builder while using ranked reports.  Like the eye-strain issue talked about above, the amount of time that it took for reports to build never really seemed like an issue to me.  Perhaps that’s the SAS programmer side of me that often waits hours to return a result of a complex set of commands.

But now that I’ve used the table builder, it’s definitely an improvement on how data tables get built.  You get to specify each element you want in the table first, THEN the data gets retrieved.  It may sound like a small change, but when you already know what you want, not having to wait for the table to build while you keep dragging in metrics does feel like it’s way faster to get the table you are looking for.

Adobe Discover 3 - Definitely an improvement

There are probably 20 other things I haven’t noticed yet in the new Discover 3 interface, but from what I have used so far, this is a great upgrade in functionality!  It feels faster to get things completed with the table builder and the new pathing functionality across all variable types is a long time coming.  Now, if only there was a different color palette I could choose, it’d be perfect…maybe something like this?

omniture-discover-1.5

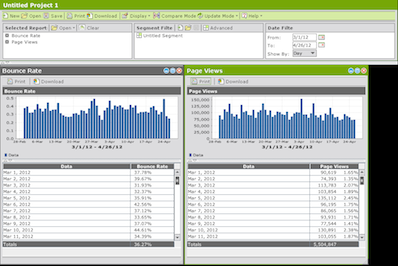
You should prefer green, not carbon.

  • RSiteCatalyst Version 1.4.16 Release Notes
  • Using RSiteCatalyst With Microsoft PowerBI Desktop
  • RSiteCatalyst Version 1.4.14 Release Notes
  • RSiteCatalyst Version 1.4.13 Release Notes
  • RSiteCatalyst Version 1.4.12 (and 1.4.11) Release Notes
  • Self-Service Adobe Analytics Data Feeds!
  • RSiteCatalyst Version 1.4.10 Release Notes
  • WordPress to Jekyll: A 30x Speedup
  • Bulk Downloading Adobe Analytics Data
  • Adobe Analytics Clickstream Data Feed: Calculations and Outlier Analysis
  • Adobe: Give Credit. You DID NOT Write RSiteCatalyst.
  • RSiteCatalyst Version 1.4.8 Release Notes
  • Adobe Analytics Clickstream Data Feed: Loading To Relational Database
  • Calling RSiteCatalyst From Python
  • RSiteCatalyst Version 1.4.7 (and 1.4.6.) Release Notes
  • RSiteCatalyst Version 1.4.5 Release Notes
  • Getting Started: Adobe Analytics Clickstream Data Feed
  • RSiteCatalyst Version 1.4.4 Release Notes
  • RSiteCatalyst Version 1.4.3 Release Notes
  • RSiteCatalyst Version 1.4.2 Release Notes
  • Destroy Your Data Using Excel With This One Weird Trick!
  • RSiteCatalyst Version 1.4.1 Release Notes
  • Visualizing Website Pathing With Sankey Charts
  • Visualizing Website Structure With Network Graphs
  • RSiteCatalyst Version 1.4 Release Notes
  • Maybe I Don't Really Know R After All
  • Building JSON in R: Three Methods
  • Real-time Reporting with the Adobe Analytics API
  • RSiteCatalyst Version 1.3 Release Notes
  • Adobe Analytics Implementation Documentation in 60 Seconds
  • RSiteCatalyst Version 1.2 Release Notes
  • Clustering Search Keywords Using K-Means Clustering
  • RSiteCatalyst Version 1.1 Release Notes
  • Anomaly Detection Using The Adobe Analytics API
  • (not provided): Using R and the Google Analytics API
  • My Top 20 Least Useful Omniture Reports
  • For Maximum User Understanding, Customize the SiteCatalyst Menu
  • Effect Of Modified Bounce Rate In Google Analytics
  • Adobe Discover 3: First Impressions
  • Using Omniture SiteCatalyst Target Report To Calculate YOY growth
  • ODSC webinar: End-to-End Data Science Without Leaving the GPU
  • PyData NYC 2018: End-to-End Data Science Without Leaving the GPU
  • Data Science Without Leaving the GPU
  • Getting Started With OmniSci, Part 2: Electricity Dataset
  • Getting Started With OmniSci, Part 1: Docker Install and Loading Data
  • Parallelizing Distance Calculations Using A GPU With CUDAnative.jl
  • Building a Data Science Workstation (2017)
  • JuliaCon 2015: Everyday Analytics and Visualization (video)
  • Vega.jl, Rebooted
  • Sessionizing Log Data Using data.table [Follow-up #2]
  • Sessionizing Log Data Using dplyr [Follow-up]
  • Sessionizing Log Data Using SQL
  • Review: Data Science at the Command Line
  • Introducing Twitter.jl
  • Code Refactoring Using Metaprogramming
  • Evaluating BreakoutDetection
  • Creating A Stacked Bar Chart in Seaborn
  • Visualizing Analytics Languages With VennEuler.jl
  • String Interpolation for Fun and Profit
  • Using Julia As A "Glue" Language
  • Five Hard-Won Lessons Using Hive
  • Using SQL Workbench with Apache Hive
  • Getting Started With Hadoop, Final: Analysis Using Hive & Pig
  • Quickly Create Dummy Variables in a Data Frame
  • Using Amazon EC2 with IPython Notebook
  • Adding Line Numbers in IPython/Jupyter Notebooks
  • Fun With Just-In-Time Compiling: Julia, Python, R and pqR
  • Getting Started Using Hadoop, Part 4: Creating Tables With Hive
  • Tabular Data I/O in Julia
  • Hadoop Streaming with Amazon Elastic MapReduce, Python and mrjob
  • A Beginner's Look at Julia
  • Getting Started Using Hadoop, Part 3: Loading Data
  • Innovation Will Never Be At The Push Of A Button
  • Getting Started Using Hadoop, Part 2: Building a Cluster
  • Getting Started Using Hadoop, Part 1: Intro
  • Instructions for Installing & Using R on Amazon EC2
  • Video: SQL Queries in R using sqldf
  • Video: Overlay Histogram in R (Normal, Density, Another Series)
  • Video: R, RStudio, Rcmdr & rattle
  • Getting Started Using R, Part 2: Rcmdr
  • Getting Started Using R, Part 1: RStudio
  • Learning R Has Really Made Me Appreciate SAS