Over my career as a predictive modeler/data scientist, the most important step(s) in any data project without question have been data cleaning and feature engineering. By taking the data you have, correcting flaws and reformulating raw data into additional business-specific concepts, you ensure that you move beyond pure mathematical optimization and actually solve a business problem. While “big data” is often held up as the future of knowing everything, when it comes down to it, a Hadoop cluster is more often a “Ha-dump” cluster: the place data gets dumped without any proper ETL.
For this blog post, I’m going to highlight a common request for time-series data: combining discrete events into sessions. Whether you are dealing with sensor data, television viewing data, digital analytics data or any other stream of events, the problem of interest is usually how a human interacts with a machine over a given period of time, not each individual event.
While I usually use Hive (Hadoop) for daily work, I’m going to use Postgres (via OSX Postgres.app) to make this as widely accessible as possible. In general, this process will work with any infrastructure/SQL-dialect that supports window functions.
Connecting to Database/Load Data
For lightweight tasks, I find using psql (command-line tool) is easy enough. Here are the commands to create a database to hold our data and to load our two .csv files (download here and here):
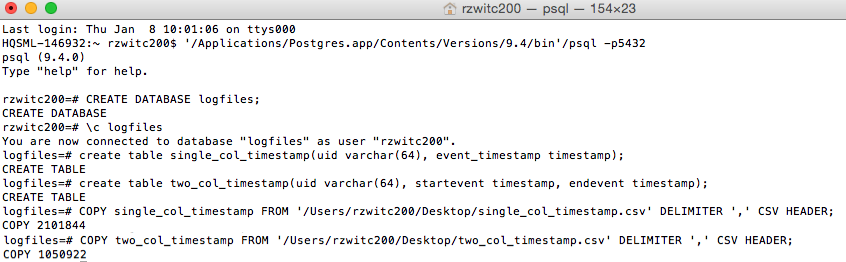
These files contain timestamps generated for 1000 uid values.
Query 1 (“Inner”): Determining Session Boundary Using A Window Function
In order to determine the boundary of each session, we can use a window function along with lag(), which will allow the current row being processed to compare vs. the prior row. Of course, for all of this to work correctly, we need to have our data sorted in time order by each of our users:
1
2
3
4
5
6
7
--Create boundaries at 30 minute timeout
select
uid,
event_timestamp,
(extract(epoch from event_timestamp) - lag(extract(epoch from event_timestamp)) OVER (PARTITION BY uid ORDER BY event_timestamp))/60 as minutes_since_last_interval,
case when extract(epoch from event_timestamp) - lag(extract(epoch from event_timestamp)) OVER (PARTITION BY uid ORDER BY event_timestamp) > 30 * 60 then 1 ELSE 0 END as new_event_boundary
from single_col_timestamp;
For this query, we use the lag() function on the event_timestamp column, and we use over partition by uid order by event_timestamp to define the window over which we want to do our calculation. To provide additional clarification about how this syntax works, I’ve added a column showing how many minutes have passed between intervals to validate that the 30-minute window is calculated correctly. The result is as follows:
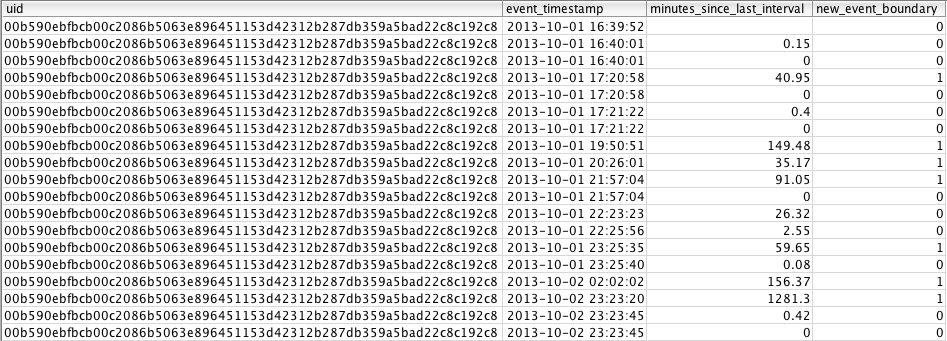
For each row where the value of minutes_since_last_interval > 30, there is a value of 1 for new_event_boundary.
Query 2 (“Outer”): Creating A Session ID
The query above defines the event boundaries (which is helpful), but if we want to calculate session-level metrics, we need to create a unique id for each set of rows that are part of one session. To do this, we’re again going to use a window function:
1
2
3
4
5
6
7
8
9
10
11
12
13
14
15
select
uid,
sum(new_event_boundary) OVER (PARTITION BY uid ORDER BY event_timestamp) as session_id,
event_timestamp,
minutes_since_last_interval,
new_event_boundary
from
			--Query 1: Define boundary events
			(select
			uid,
			event_timestamp,
			(extract(epoch from event_timestamp) - lag(extract(epoch from event_timestamp)) OVER (PARTITION BY uid ORDER BY event_timestamp))/60 as minutes_since_last_interval,
			case when extract(epoch from event_timestamp) - lag(extract(epoch from event_timestamp)) OVER (PARTITION BY uid ORDER BY event_timestamp) > 30 * 60 then 1 ELSE 0 END as new_event_boundary
			from single_col_timestamp
			) a;
This query defines the same over partition by uid order by event_timestamp window, but rather than using lag() this time, we’re going to use sum() for the outer query. The effect of using sum() in our window function is to do a cumulative sum; every time 1 shows up, the session_id field gets incremented by 1. If there is a value of 0, the sum is still the same as the row above and thus has the same session_id. This is easier to understand visually:
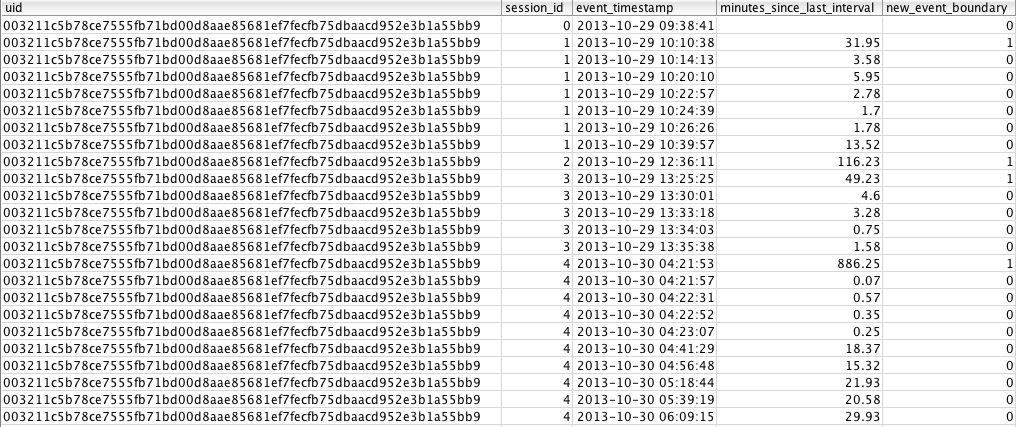
At this point, we have a session_id for a group of rows where there have been no 30 minute gaps in behavior.
Final Query: Cleaned Up
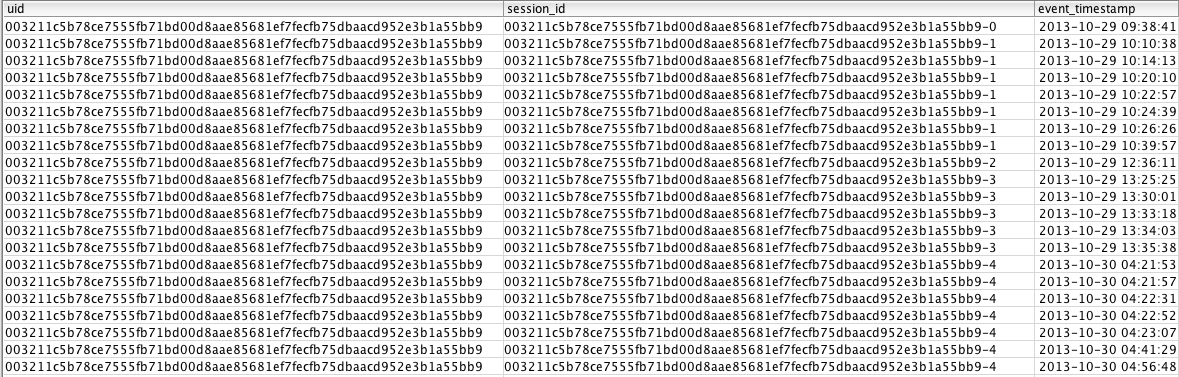
Although the previous section is technically done, I usually concatenate the uid and session_id together. I do this concatenation just to highlight that the value is usually a ‘key’ value, not a metric in itself (though it can be). Concatenating the keys together and removing the teaching columns results in the following query:
1
2
3
4
5
6
7
8
9
10
11
12
13
--Query 3:  Outer query uses window function with sum to do cumulative sum as the id, concatentate to uid
select
uid,
uid || '-' || cast(sum(new_event_boundary) OVER (PARTITION BY uid ORDER BY event_timestamp) as varchar) as session_id,
event_timestamp
from
			--Query 1: Define boundary events
			(select
			uid,
			event_timestamp,
			case when extract(epoch from event_timestamp) - lag(extract(epoch from event_timestamp)) OVER (PARTITION BY uid ORDER BY event_timestamp) > 30 * 60 then 1 ELSE 0 END as new_event_boundary
			from single_col_timestamp
			) a;
Window Functions, Will You Marry Me?
The first time I was asked to try and solve sessionization of time-series data using Hive, I was sure the answer would be that I’d have to get a peer to write some nasty custom Java code to be able generate unique ids; in retrospect, the solution is so obvious and simple that I wish I would’ve tried to do this years ago. This is a pretty easy problem to solve using imperative programming, but if you’ve got a gigantic amount of hardware in a RDBMS or Hadoop, SQL takes care of all of the calculation without needing think through looping (or more complicated logic/data structures).
Window functions fall into a weird space in the SQL language, given that they allow you to do sequential calculations when SQL should generally be thought of as “set-level” calculations (i.e. no implied order and table-wide calculations vs. row/state-specific). But now that I’ve got a hang of them, I can’t imagine my analytical life without them.