Adding Line Numbers in IPython/Jupyter Notebooks

Lately, I’ve been using Jupyter Notebooks for all of my Python and Julia coding. The ability to develop and submit small snippets of code and create plots inline is just so useful that it has broken the stranglehold of using an IDE while I’m coding. However, the one thing that was missing for a smooth transition was line numbers in the cells; luckily, this can be achieved in two ways.

Keyboard Shortcut

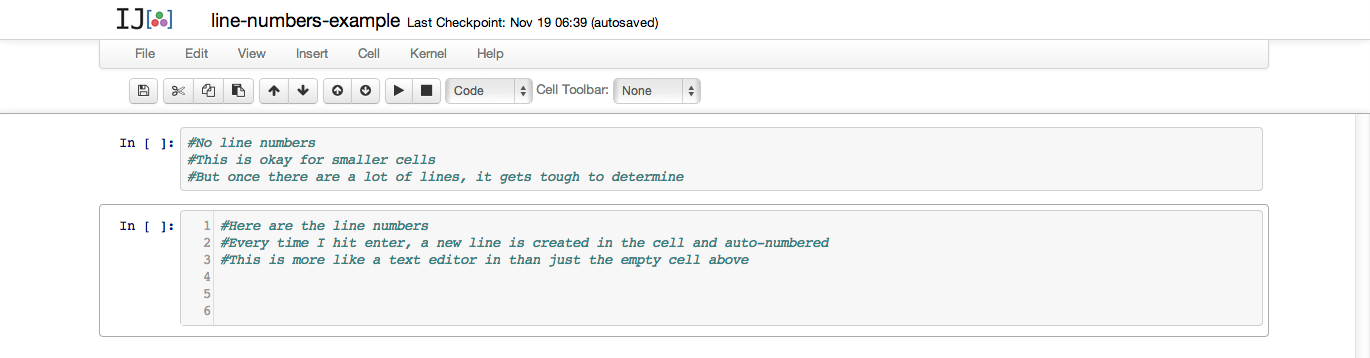
The easiest way to add line numbers to a Jupyter Notebook is to use the keyboard shortcut, which is Ctrl-m to enter Command Mode, then type L. Just highlight the cell you are interested in adding line numbers to, then hit the keyboard shortcut to toggle the line numbers.

ipython-notebook-line-numbers

Add Line Numbers to All Cells at Startup

While the keyboard shortcut is great for toggling line numbers on/off, I prefer having line numbers always on. Luckily, the IPython Dev folks on Twitter were kind enough to explain how to do this:

I use OSX with the default ‘profile_default’ profile, so the path for my custom.js file for IPython is:

/Users/randyzwitch/.ipython/profile_default/static/custom/

Similarly, you can do the same for IJulia:

/Users/randyzwitch/.ipython/profile_julia/static/custom

If you are using a different operating system than OSX, or you are using OSX and you don’t see a custom.js file in these locations, a quick search for custom.js will get you to the right file location. Once you open up the custom.js file, you can place the line of JavaScript anywhere in the file, as long as it’s not inside any of any pre-existing functions in the file.

Once you place the line of JavaScript in your file, you’ll need to restart IPython/IJulia completely for the change to take effect. After that, you’ll have line numbers in each cell, each Notebook!

Edit 11/4/2015: Thanks to reader Nat Dunn, I’ve been made aware that the above method no longer works, which isn’t a surprise given the amount of changes between IPython Notebook to the entire Jupyter project in the past 2 years.

For the (currently) correct method of adding line numbers to Jupyter Notebook by default, please see Nat’s post with the correct instructions on modifying the custom.js file.

  • RSiteCatalyst Version 1.4.16 Release Notes
  • Using RSiteCatalyst With Microsoft PowerBI Desktop
  • RSiteCatalyst Version 1.4.14 Release Notes
  • RSiteCatalyst Version 1.4.13 Release Notes
  • RSiteCatalyst Version 1.4.12 (and 1.4.11) Release Notes
  • Self-Service Adobe Analytics Data Feeds!
  • RSiteCatalyst Version 1.4.10 Release Notes
  • WordPress to Jekyll: A 30x Speedup
  • Bulk Downloading Adobe Analytics Data
  • Adobe Analytics Clickstream Data Feed: Calculations and Outlier Analysis
  • Adobe: Give Credit. You DID NOT Write RSiteCatalyst.
  • RSiteCatalyst Version 1.4.8 Release Notes
  • Adobe Analytics Clickstream Data Feed: Loading To Relational Database
  • Calling RSiteCatalyst From Python
  • RSiteCatalyst Version 1.4.7 (and 1.4.6.) Release Notes
  • RSiteCatalyst Version 1.4.5 Release Notes
  • Getting Started: Adobe Analytics Clickstream Data Feed
  • RSiteCatalyst Version 1.4.4 Release Notes
  • RSiteCatalyst Version 1.4.3 Release Notes
  • RSiteCatalyst Version 1.4.2 Release Notes
  • Destroy Your Data Using Excel With This One Weird Trick!
  • RSiteCatalyst Version 1.4.1 Release Notes
  • Visualizing Website Pathing With Sankey Charts
  • Visualizing Website Structure With Network Graphs
  • RSiteCatalyst Version 1.4 Release Notes
  • Maybe I Don't Really Know R After All
  • Building JSON in R: Three Methods
  • Real-time Reporting with the Adobe Analytics API
  • RSiteCatalyst Version 1.3 Release Notes
  • Adobe Analytics Implementation Documentation in 60 Seconds
  • RSiteCatalyst Version 1.2 Release Notes
  • Clustering Search Keywords Using K-Means Clustering
  • RSiteCatalyst Version 1.1 Release Notes
  • Anomaly Detection Using The Adobe Analytics API
  • (not provided): Using R and the Google Analytics API
  • My Top 20 Least Useful Omniture Reports
  • For Maximum User Understanding, Customize the SiteCatalyst Menu
  • Effect Of Modified Bounce Rate In Google Analytics
  • Adobe Discover 3: First Impressions
  • Using Omniture SiteCatalyst Target Report To Calculate YOY growth
  • ODSC webinar: End-to-End Data Science Without Leaving the GPU
  • PyData NYC 2018: End-to-End Data Science Without Leaving the GPU
  • Data Science Without Leaving the GPU
  • Getting Started With OmniSci, Part 2: Electricity Dataset
  • Getting Started With OmniSci, Part 1: Docker Install and Loading Data
  • Parallelizing Distance Calculations Using A GPU With CUDAnative.jl
  • Building a Data Science Workstation (2017)
  • JuliaCon 2015: Everyday Analytics and Visualization (video)
  • Vega.jl, Rebooted
  • Sessionizing Log Data Using data.table [Follow-up #2]
  • Sessionizing Log Data Using dplyr [Follow-up]
  • Sessionizing Log Data Using SQL
  • Review: Data Science at the Command Line
  • Introducing Twitter.jl
  • Code Refactoring Using Metaprogramming
  • Evaluating BreakoutDetection
  • Creating A Stacked Bar Chart in Seaborn
  • Visualizing Analytics Languages With VennEuler.jl
  • String Interpolation for Fun and Profit
  • Using Julia As A "Glue" Language
  • Five Hard-Won Lessons Using Hive
  • Using SQL Workbench with Apache Hive
  • Getting Started With Hadoop, Final: Analysis Using Hive & Pig
  • Quickly Create Dummy Variables in a Data Frame
  • Using Amazon EC2 with IPython Notebook
  • Adding Line Numbers in IPython/Jupyter Notebooks
  • Fun With Just-In-Time Compiling: Julia, Python, R and pqR
  • Getting Started Using Hadoop, Part 4: Creating Tables With Hive
  • Tabular Data I/O in Julia
  • Hadoop Streaming with Amazon Elastic MapReduce, Python and mrjob
  • A Beginner's Look at Julia
  • Getting Started Using Hadoop, Part 3: Loading Data
  • Innovation Will Never Be At The Push Of A Button
  • Getting Started Using Hadoop, Part 2: Building a Cluster
  • Getting Started Using Hadoop, Part 1: Intro
  • Instructions for Installing & Using R on Amazon EC2
  • Video: SQL Queries in R using sqldf
  • Video: Overlay Histogram in R (Normal, Density, Another Series)
  • Video: R, RStudio, Rcmdr & rattle
  • Getting Started Using R, Part 2: Rcmdr
  • Getting Started Using R, Part 1: RStudio
  • Learning R Has Really Made Me Appreciate SAS