Maybe I Don't Really Know R After All

Lately, I’ve been feeling that I’m spreading myself too thin in terms of programming languages. At work, I spend most of my time in Hive/SQL, with the occasional Python for my smaller data. I really prefer Julia, but I’m alone at work on that one. And since I maintain a package on CRAN (RSiteCatalyst), I frequently spend my evenings bug fix programming in R. Then, there’s the desire to learn a Java-based language like Scala (or, Java)…maybe Spark for my Hadoop work…

So last night, when I ran into this series of follies with R, it really makes me wonder if I really understand how R works.

jsonlite:fromJSON

As part of the overall concept of my RSiteCatalyst package, I’m trying to make it as easy as possible for digital analysts to get their data via the Adobe Analytics API.  As such, I abstract away the need to build JSON to request reports and parse the API answer from JSON to a data frame. Sometimes it’s easy, but sometimes you get something like this:

nested_r_dataframe

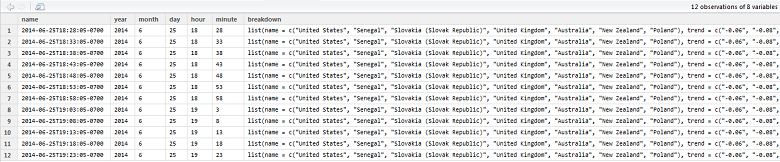
In case it’s not clear what’s going on here, fromJSON() from jsonlite returns a data frame as best as it can, but we have a list (of data frames!) nested inside of a column named “breakdown”. There are 12 rows here, but the proper data structure would be to take the data frame inside of ‘breakdown’ and append all of the fields from the original 12 rows, repeating the values down the rows. So something like 72 rows (12 original rows, 6 row data frames inside of the ‘breakdown’ column).

Loop and Accumulate

Because this is such a small data frame, and because *apply functions are too frustrating in most cases, to parse this I went with the tried-and-true loop and accumulate. But instead of immediately getting what I wanted, I got this fantastic R error message:

1
2
3
4
5
6
7
8
9
10
11
12
#Loop over df and accumulate results
parsed_df <- data.frame()
for(i in 1:nrow(df)){
  temp <- cbind(df[i,],breakdown_list[[i]])
  parsed_df <- rbind(parsed_df, temp)
}

There were 12 warnings (use warnings() to see them)
>warnings()
Warning messages:
  1: In data.frame(..., check.names = FALSE) :
  row names were found from a short variable and have been discarded

Row names from a short variable? Off to StackOverflow, the savior of all language hackers, which lets me know I just need to add an argument to my cbind() function. Trying again:

1
2
3
4
5
6
7
8
9
10
11
12
13
#Loop over df and accumulate results
#Adding row.names = NULL fixes error message
parsed_df <- data.frame()
for(i in 1:nrow(df)){
  temp <- cbind(df[i,],breakdown_list[[i]], row.names = NULL)
  parsed_df <- rbind(parsed_df, temp)
}

names(parsed_df)

> names(parsed_df)
 [1] "name"           "year"           "month"          "day"            "hour"           "minute"         "breakdownTotal"
 [8] "name"           "trend"          "counts"  

So I successfully created an (84,10)-sized data frame, but cbind() allowed me to name two columns in the data frame “name”! Running ‘parsed_df$name’ at the REPL returns the first instance. So now, I have to use the unstable method of referring to the second ‘name’ column by position number if I want to access it (or, rename it using names() of course). The way I realized this behavior was occurring was that I tried to use plyr::rename and kept changing the name of two columns!

Final Solution

In order to get past my duplicate name issue, I eventually renamed the ‘name’ columns individually by each object, prior to cbind():

1
2
3
4
5
6
7
8
9
10
11
12
13
14
#Separate breakdown list and original data frame into different objects
df <- ex_df$report$data
breakdown_list <- df$breakdown
df$breakdown <- NULL

#Loop over df and accumulate results
parsed_df <- data.frame()
for(i in 1:nrow(df)){
  right_df <-  breakdown_list[[i]]
  right_df <- rename(right_df, replace=c("name" = report_raw$report$elements$id[2]))
  temp <- cbind(df[i,],right_df, row.names = NULL)
  parsed_df <- rbind(parsed_df, temp)
}
parsed_df <- rename(parsed_df, replace=c("counts" = report_raw$report$metrics$id))

In the end, I found an answer to my solution, but it seems like every time I use R the more oddities I’m able to encounter/generate. At this point, I’m starting to question whether I really understand the underpinnings of how R works. It might be time to stop trying to be a language polyglot so much and focus on really learning a few of these tools in-depth.

  • RSiteCatalyst Version 1.4.16 Release Notes
  • Using RSiteCatalyst With Microsoft PowerBI Desktop
  • RSiteCatalyst Version 1.4.14 Release Notes
  • RSiteCatalyst Version 1.4.13 Release Notes
  • RSiteCatalyst Version 1.4.12 (and 1.4.11) Release Notes
  • Self-Service Adobe Analytics Data Feeds!
  • RSiteCatalyst Version 1.4.10 Release Notes
  • WordPress to Jekyll: A 30x Speedup
  • Bulk Downloading Adobe Analytics Data
  • Adobe Analytics Clickstream Data Feed: Calculations and Outlier Analysis
  • Adobe: Give Credit. You DID NOT Write RSiteCatalyst.
  • RSiteCatalyst Version 1.4.8 Release Notes
  • Adobe Analytics Clickstream Data Feed: Loading To Relational Database
  • Calling RSiteCatalyst From Python
  • RSiteCatalyst Version 1.4.7 (and 1.4.6.) Release Notes
  • RSiteCatalyst Version 1.4.5 Release Notes
  • Getting Started: Adobe Analytics Clickstream Data Feed
  • RSiteCatalyst Version 1.4.4 Release Notes
  • RSiteCatalyst Version 1.4.3 Release Notes
  • RSiteCatalyst Version 1.4.2 Release Notes
  • Destroy Your Data Using Excel With This One Weird Trick!
  • RSiteCatalyst Version 1.4.1 Release Notes
  • Visualizing Website Pathing With Sankey Charts
  • Visualizing Website Structure With Network Graphs
  • RSiteCatalyst Version 1.4 Release Notes
  • Maybe I Don't Really Know R After All
  • Building JSON in R: Three Methods
  • Real-time Reporting with the Adobe Analytics API
  • RSiteCatalyst Version 1.3 Release Notes
  • Adobe Analytics Implementation Documentation in 60 Seconds
  • RSiteCatalyst Version 1.2 Release Notes
  • Clustering Search Keywords Using K-Means Clustering
  • RSiteCatalyst Version 1.1 Release Notes
  • Anomaly Detection Using The Adobe Analytics API
  • (not provided): Using R and the Google Analytics API
  • My Top 20 Least Useful Omniture Reports
  • For Maximum User Understanding, Customize the SiteCatalyst Menu
  • Effect Of Modified Bounce Rate In Google Analytics
  • Adobe Discover 3: First Impressions
  • Using Omniture SiteCatalyst Target Report To Calculate YOY growth
  • ODSC webinar: End-to-End Data Science Without Leaving the GPU
  • PyData NYC 2018: End-to-End Data Science Without Leaving the GPU
  • Data Science Without Leaving the GPU
  • Getting Started With OmniSci, Part 2: Electricity Dataset
  • Getting Started With OmniSci, Part 1: Docker Install and Loading Data
  • Parallelizing Distance Calculations Using A GPU With CUDAnative.jl
  • Building a Data Science Workstation (2017)
  • JuliaCon 2015: Everyday Analytics and Visualization (video)
  • Vega.jl, Rebooted
  • Sessionizing Log Data Using data.table [Follow-up #2]
  • Sessionizing Log Data Using dplyr [Follow-up]
  • Sessionizing Log Data Using SQL
  • Review: Data Science at the Command Line
  • Introducing Twitter.jl
  • Code Refactoring Using Metaprogramming
  • Evaluating BreakoutDetection
  • Creating A Stacked Bar Chart in Seaborn
  • Visualizing Analytics Languages With VennEuler.jl
  • String Interpolation for Fun and Profit
  • Using Julia As A "Glue" Language
  • Five Hard-Won Lessons Using Hive
  • Using SQL Workbench with Apache Hive
  • Getting Started With Hadoop, Final: Analysis Using Hive & Pig
  • Quickly Create Dummy Variables in a Data Frame
  • Using Amazon EC2 with IPython Notebook
  • Adding Line Numbers in IPython/Jupyter Notebooks
  • Fun With Just-In-Time Compiling: Julia, Python, R and pqR
  • Getting Started Using Hadoop, Part 4: Creating Tables With Hive
  • Tabular Data I/O in Julia
  • Hadoop Streaming with Amazon Elastic MapReduce, Python and mrjob
  • A Beginner's Look at Julia
  • Getting Started Using Hadoop, Part 3: Loading Data
  • Innovation Will Never Be At The Push Of A Button
  • Getting Started Using Hadoop, Part 2: Building a Cluster
  • Getting Started Using Hadoop, Part 1: Intro
  • Instructions for Installing & Using R on Amazon EC2
  • Video: SQL Queries in R using sqldf
  • Video: Overlay Histogram in R (Normal, Density, Another Series)
  • Video: R, RStudio, Rcmdr & rattle
  • Getting Started Using R, Part 2: Rcmdr
  • Getting Started Using R, Part 1: RStudio
  • Learning R Has Really Made Me Appreciate SAS