Before using the real-time reporting capabilities of Adobe Analytics, you first need to indicate which metrics and elements you are interested in seeing in real-time. To see which reports are already set up for real-time access on a given report suite, you can use the GetRealTimeConfiguration() function:
1
2
#Get Real-Time reports that already set uprealtime_reports<-GetRealTimeConfiguration("<reportsuite>")
It’s likely the case that the first time you set this up, you’ll already see a real-time report for ‘Instances-Page-Site Section-Referring Domain’. You can leave this report in place, or switch the parameters using SaveRealTimeConfiguration().
SaveRealTimeConfiguration
If you want to add/modify which real-time reports are available in a report suite, you can use the SaveRealTimeConfiguration() function:
Up to three real-time reports are available to be stored at any given time. Note that you can mix-and-match what reports you want to modify, you don’t have to submit all three reports at a given time. Finally, keep in mind that it can take up to 15 minutes for the API to incorporate your real-time report changes, so if you don’t get your data right away don’t keep re-submitting the function call!
GetRealTimeReport
Once you have your real-time reports set up in the API, you can use the GetRealTimeReport() function in order to access your reports. There are numerous parameters for customization; selected examples are below.
Minimum Example - Overtime Report
The simplest function call for a real-time report is to create an Overtime report (monitoring a metric over a specific time period):
The result of this call will be a DataFrame having 15 rows of one minute granularity for your metric. This is a great way to monitor real-time orders & revenue during a flash sale, see how users are accessing a landing page for an email marketing campaign or any other metric where you want up-to-the-minute status updates.
Granularity, Offset, Periods
If you want to have a time period other than the last 15 minutes, or one minute granularity is too volatile for the metric you are monitoring, you can add additional arguments to modify the returned DataFrame:
For this function call, we will receive instances for the last hour (12 periods) of five minute granularity, with a 10 minute offset (meaning, now - 10 minutes ago is the first time period reported).
Single Elements
Beyond just monitoring a metric over time, you can specify an element such as page to receive your metrics by:
This function call will return Instances by Page, for the last 27 minutes (3 rows/periods per page, 9 minute granularity…just because!). Additionally, there are other arguments such as algorithm, algorithmArgument, firstRankPeriod and floorSensitivity that allow for creating reports similar to what is provided in the Real-Time tab in the Adobe Analytics interface.
Currently, even through the Adobe Analytics API supports real-time reports with three breakdowns, only one element breakdown is supported by RSiteCatalyst; it is planned to extend these functions in RSiteCatalyst to full support the real-time capabilities in the near future.
From DataFrame to Something ‘Shiny’
If we’re talking real-time reports, we’re probably talking about dashboarding. If we’re talking about R and dashboarding, then naturally, ggvis/Shiny comes to mind. While providing a full ggvis/Shiny example is beyond the scope of this blog post, it’s my hope to provide a working example in a future blog post. Stay tuned!
Version 1.3 of the RSiteCatalyst package to access the Adobe Analytics API is now available on CRAN! Changes include:
Search via regex functionality in QueueRanked/QueueTrended functions
Support for Realtime API reports: Overtime and one-element Ranked report
Allow for variable API request timing in Queue*` functions
Fixed validate flag in JSON request to work correctly
Deprecated GetAdminConsoleLog (appears to be removed from the API)
Searching via Regex functionality
RSiteCatalyst now supports the search functionality of the API, similar in nature to using the Advanced Filter/Search feature within Reports & Analytics. Here are some examples for the QueueRanked function:
#Top 100 Pages where the pagename starts with "Categories"#Uses searchKW argumentqueue_ranked_pages_search<-QueueRanked("<reportsuite>","2013-01-01","2014-01-28",c("pageviews","visits"),"page",top="100",searchKW="^Categories")#Top 100 Pages where the pagename starts with "Categories" OR contains "Home Page"#Uses searchKW and searchType argumentsqueue_ranked_pages_search_or<-QueueRanked("<reportsuite>","2013-01-01","2014-01-28",c("pageviews","visits"),"page",top="100",searchKW=c("^Categories","Home Page"),searchType="OR")
QueueTrended function calls work in a similar manner, returning elements broken down by time rather than a single record per element name.
Realtime Reporting API
Accessing the Adobe Analytics Realtime API now has limited support in RSiteCatalyst. Note that this is different than just using the currentData parameter within the Queue* functions, as the realtime API methods provide data within a minute of that data being generated on-site. Currently, RSiteCatalyst only supports the most common types of reports: Overtime (no eVar or prop breakdown) and one-element breakdown.
Because of the extensive new functionality for the GetRealTimeConfiguration(), SaveRealTimeConfiguration() and GetRealTimeReport() functions, code examples will be provided as a separate blog post.
Variable request timing for Queue function calls
This feature is to fix the issue of having an API request run so long that RSiteCatalyst gave up on retrieving an answer. Usually, API requests come back in a few seconds, but in selected cases a call could run so long as to exhaust the number of attempts (previously, 10 minutes). You can use the maxTries and waitTime arguments to specify how many times you’d like RSiteCatalyst to retrieve the report and the wait time between calls:
1
2
3
4
5
6
7
8
9
10
11
12
#Change timing of function call#Wait 30 seconds between attempts to retrieve the report, try 5 timesqueue_overtime_visits_pv_day_social_anomaly2<-QueueOvertime("<reportsuite>","2013-01-01","2014-01-28",c("visits","pageviews"),"day","Visit_Social",anomalyDetection="1",currentData="1",maxTries=5,waitTime=30)
If you don’t specify either of these arguments, RSiteCatalyst will default to trying every five seconds to retrieve the report, up to 120 tries.
New Contributor: Willem Paling
I’m pleased to announce that I’ve got a new contributor for RSiteCatalyst, Willem Paling! Willem did a near-complete re-write of the underlying code to access the API, and rather than have multiple packages out in the wild, we’ve decided to merge our works. So look forward to better-written R code and more complete access to the Adobe Analytics API’s in future releases…
Support
If you run into any problems with RSiteCatalyst, please file an issue on GitHub so it can be tracked properly. Note that I’m not an Adobe employee, so I can only provide so much support, as in most cases I can’t validate your settings to ensure you are set up correctly (nor do I have any inside information about how the system works :) )
Edit 2/20/2014: I mistakenly forgot to add the new real-time functions to the R NAMESPACE file, and as such, you won’t be able to use them if you are using version 1.3. Upgrade to 1.3.1 to access the real-time functionality.
We’ve finally made it to the final post in this tutorial! In my prior posts about getting started with Hadoop, we’ve covered the entire lifecycle from how to set up a small cluster using Amazon EC2 and Cloudera through how to load data using Hue. With our data loaded in HDFS, we can finally move on to the actual analysis portion of the airline dataset using Hive and Pig.
Basic Descriptive Statistics Using Hive
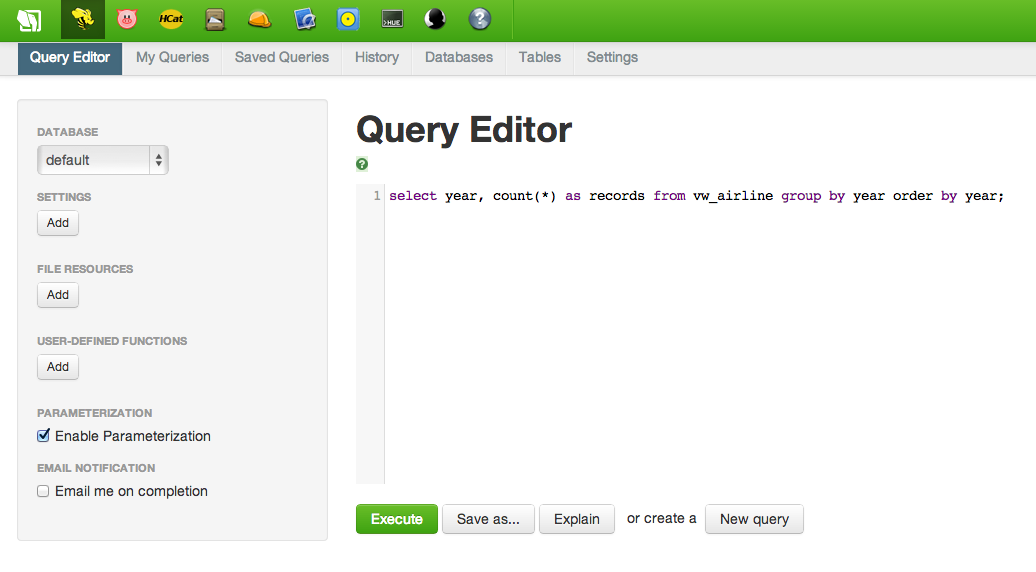
In part 4 of this tutorial, we used a Hive script to create a view named “vw_airline” to hold all of our airline data. Running a simple query is as easy as running the following in the Hive window in Hue. Note that this is ANSI-standard SQL code, even though we are submitting it using Hive:
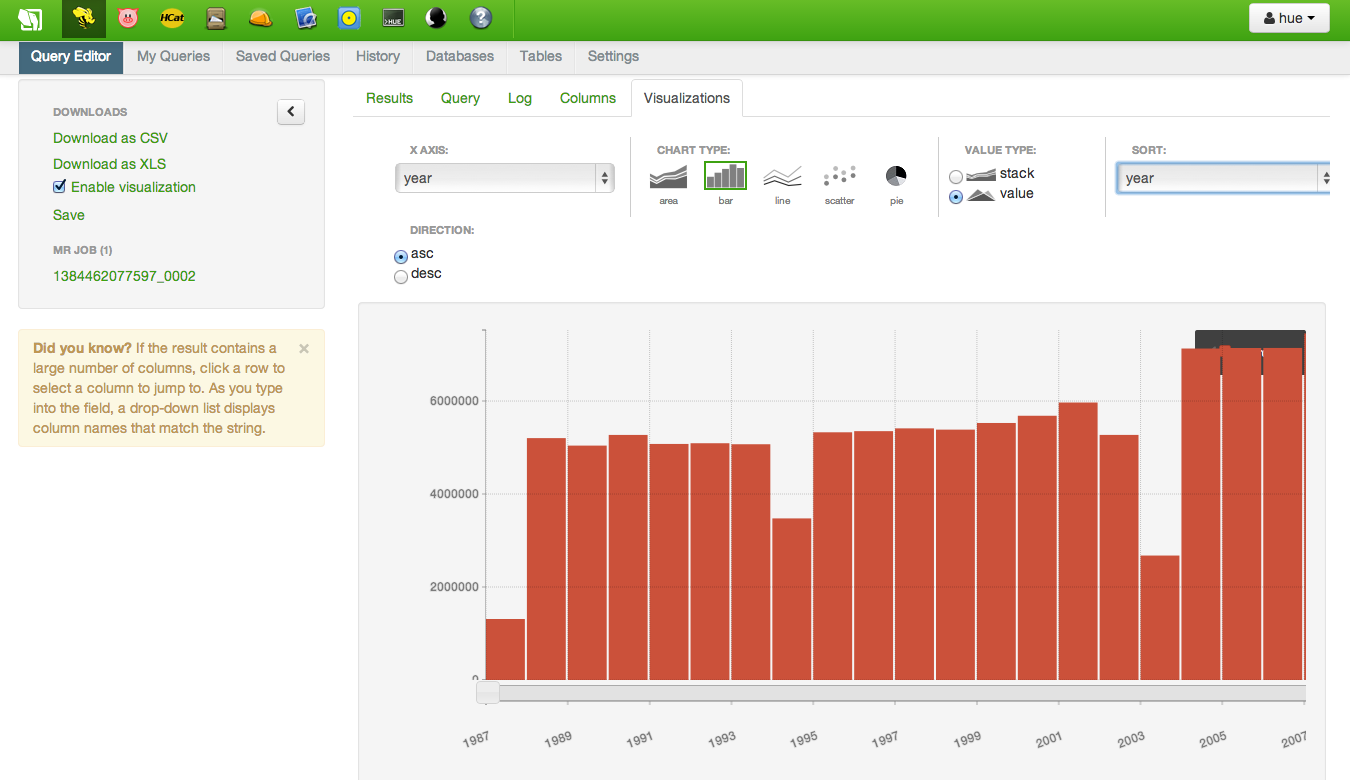
A simple query like this is a great way to get a feel for the table, including determining whether or not the files were loaded correctly. Once the results are displayed, you can create simple visualizations like bar charts, line plots, scatterplots and pie charts. The results of the following query are shown below. Knowing this dataset, I can tell that the files were loaded incorrectly; the dips at Years 1994 and 2004 are too few records and will need to be reloaded.
1994 and 2004 have too few rows, which was validated using wc -l 1994.csv at the command line (outside of Hadoop)
Besides just simple counts, Hive supports nearly all standard SQL syntax relative to functions such as SUM, COUNT, MIN, MAX, etc., table joins, user-defined functions (UDF)`, window functions…pretty much everything that you are used to from other SQL tools. AFAIK, the only thing that Hive doesn’t support is nested sub-queries, but that’s on the Stinger initiative for improving Hive. However, depending on the nested subquery being performed, you might be able to accomplish the same thing using a LEFT SEMI JOIN.
Using Pig for Analytics
It’s important to realize that Hadoop isn’t just another RDBMS where you run SQL. Using Pig, you can write scripts for calculation in a similar manner to using other high-level languages such as Python or R.
For example, suppose we wanted to calculate the average distance for each route. A Pig script to calculate this might look like the following:
1
2
3
4
5
6
7
8
9
10
11
12
13
14
15
16
17
18
19
--Load data from view to use
air = LOAD 'default.vw_airline' USING org.apache.hcatalog.pig.HCatLoader();

--Use FOREACH to limit data to origin, dest, distance
--Concatentate origin and destination together, separated by a pipe
--CONCAT appears to only allow two arguments, which is why the function is called twice (to allow 3 arguments)
origindest = FOREACH air generate CONCAT(origin, CONCAT('|' , dest)) as route, distance;

--Group origindest dataset by route
groupedroutes = GROUP origindest BY (route);

--Calculate average distance by route
avg_distance = FOREACH groupedroutes GENERATE group, AVG(origindest.distance);

--Show results in Pig shell
dump avg_distance;

--Write out results to text file, separated by tab (default)
store avg_distance into '/user/hue/avg_distance';
While it is possible to calculate average distance using Hive and a GROUP BY statement, one of the benefits to using Pig is having control over every step of the data flow. So while Hive queries tend to answer a single question at a time, Pig allows an analyst to chain together any number of steps in a data flow. In the example above, we could pass the average distance for each route to another transformation, join it back to the original dataset or do anything else our analyst minds can imagine!
Summary
Over these five blog posts, I’ve outlined how to get started with Hadoop and ‘Big Data’ using Amazon and Cloudera/Hortonworks. Hopefully I’ve been able to demystify the concepts and terminology behind Hadoop, shown that setting up a Hadoop using Cloudera on Amazon EC2 isn’t unsurmountable, and loading data and analyzing it using Hive and Pig isn’t dramatically different than using SQL on other database systems you may have encountered in the past.
While there’s a lot of hype around ‘Big Data’, data sizes aren’t going to be getting any smaller in the future. So spend the $20 in AWS charges and build a Hadoop cluster! There’s no better way to learn than by doing…