In a previous post, I outlined how to load daily Adobe Analytics Clickstream data feeds into a PostgreSQL database. While this isn’t a long-term scalable solution for large e-commerce companies doing millions of page views per day, for exploratory analysis a relational database structure can work well until a more robust solution is put into place (such as Hadoop/Spark).
Data Validation
Before digging too deeply into the data, we should validate that data from the data feed in our database (custom database view code) matches what we observe from other sources (mainly, the Adobe Analytics interface and/or RSiteCatalyst). Given the Adobe Analytics data feed represents an export of the underlying data, and Adobe provides the formulas in the data feed documentation, in theory you should be able to replicate the numbers exactly:
# "Source 1": Pull data from the API using RSiteCatalystlibrary("RSiteCatalyst")SCAuth(Sys.getenv("USER",""),Sys.getenv("SECRET",""))overtime<-QueueOvertime("zwitchdev",date.from="2016-04-01",date.to="2016-05-17",metrics=c("pageviews","visits","visitors"),date.granularity="day")# "Source 2": Pull data from Postgres databaselibrary(RPostgreSQL)# Connect to databaseconn<-dbConnect(dbDriver("PostgreSQL"),user="postgres",password="",host="localhost",port=5432,dbname="adobe")dbdata<-dbGetQuery(conn,"select
date(date_time) as date_localtime,
sum(CASE WHEN post_page_event = '0' THEN 1 END) as pageviews,
count(distinct ARRAY_TO_STRING(ARRAY[post_visid_high::text, post_visid_low::text, visit_num::text], '')) as visits,
count(distinct ARRAY_TO_STRING(ARRAY[post_visid_high::text, post_visid_low::text], '')) as visitors
from usefuldata
where date_time between '2016-04-01' and '2016-05-18' and exclude_hit = '0'
group by 1
order by 1;")# Compare data sources>diff_pv=table(overtime$pageviews-dbdata$pageviews)>diff_pv047>diff_visits=table(overtime$visits-dbdata$visits)>diff_visits047>diff_visitors=table(overtime$visitors-dbdata$visitors)>diff_visitors047
The code snippet above shows the validation, and sure enough, the “two different sources” show the same exact values (i.e. differences are 0), so everything has been loaded properly into the PostgreSQL database.
Finding Anomalies For Creating Bot Rules
With the data validated, we can now start digging deeper into the data. As an example, although I have bot filtering enabled, this only handles bots on the IAB bot list but not necessarily people trying to scrape my site (or worse).
To create a custom bot rule in Adobe Analytics, you can use IP address(es) and/or User-Agent string. However, as part of data exploration we are not limited to just these features (assuming, of course, that you can map your feature set back to an IP/User-Agent combo). To identify outlier behavior, I’m going to use a technique called ‘local outlier factors’ using the Rlof package in R with the following data features:
Distinct Days Visited
Total Pageviews
Total Visits
Distinct Pages Viewed
Pageviews Per Visit
Average Views Per Page
These aren’t the only features I could’ve used, but it should be pretty easy to view bot/scraper traffic using these metrics. Here’s the code:
# Local outlier factor calculationlibrary(RPostgreSQL)library(Rlof)conn<-dbConnect(dbDriver("PostgreSQL"),user="postgres",password="",host="localhost",port=5432,dbname="adobe")metrics_lof<-dbGetQuery(conn,"select
ip,
distinct_days_visited,
pageviews,
visits,
distinct_pages_viewed,
pageviews/visits::double precision as pv_per_visit,
pageviews/distinct_pages_viewed::double precision as avg_views_per_page
from
(
select
ip,
sum(CASE WHEN post_page_event = '0' THEN 1 END) as pageviews,
count(distinct ARRAY_TO_STRING(ARRAY[post_visid_high::text, post_visid_low::text, visit_num::text, visit_start_time_gmt::text], '')) as visits,
count(distinct post_pagename) as distinct_pages_viewed,
count(distinct date(date_time)) as distinct_days_visited
from usefuldata
where exclude_hit = '0'
group by 1
) a
where visits > 1 and pageviews > 1;")# The higher the value of k, the more likely lof will be calculated...# ...but more generic the clusters# NaN/Inf occurs with points on top of one another/div by zero, which is likely...# ...with web data when most visitors have 1-2 sessionsdf_lof<-lof(metrics_lof[,2:7],k=20)# Append results, get top 500 worst scoring IP addressesresults<-cbind(metrics_lof,df_lof)[order(-df_lof),]worst500<-head(subset(results,!is.infinite(df_lof)),500)
A local outlier factor greater than 1 is classified as a potential outlier. Here’s a visual of the lof scores for the top 500 worst scoring IP addresses (vegalite R graph code):
We can see from the graph that there are at least 500 IP addresses that are potential outliers (since the line doesn’t go below a lof value of 1). These points are now a good starting place to go back to our overall table and inspect the entire datafeed records by IP address.
But what about business value?
The example above just scratches the surface on what’s possible when you have access to the raw data from Adobe Analytics. It’s possible to do these calculations on my laptop using R because I only have a few hundred-thousand records and IP addresses. But this kind of ops work is pretty low-value, since unless you are trying to detect system hacking, trying to find hidden scrapers/spiders in your data to filter out just modifies the denominator of your KPIs it doesn’t lead to real money per se.
In the last post of this series, I’ll cover how to work with the datafeed using Spark, and provide an example of using Spark MLLib to increase site engagement.
EDIT 5/10/2016 1:30pm: Several folks from Adobe Analytics/Adobe Marketing Cloud have contacted me, and everything is resolved. I can’t untweet other people’s retweets/shares or delete comments on LinkedIn, but if everyone could stop sharing any more that would be great. 🙂
As an author of several open-source software projects, I’ve taken for granted that people using the software share the same community values as I do. Open-source authors provide their code “free” to the community so that others may benefit without having to re-invent the wheel. The only expectation (but not an actual requirement per se), is attribution to the package author(s) as a thank you for the time and effort they put into writing and maintaining a quality piece of software.
However, when others take direct credit for writing a package they did not, it crosses into a different realm. Adobe, you DID NOT write RSiteCatalyst, nor have you made any meaningful contributions. To take credit for RSiteCatalyst, either implicitly or explicitly, is a slight to the work of those who have contributed.
Adobe Summit 2014: Attribution!
In the beginning, there seemed to be no problem providing proper attribution. I count Ben Gaines as one of my stronger professional acquaintances (dare I say, even a friend), so I was honored that he not only mentioned me on stage at his Adobe Summit 2014 presentation, but also followed up with an official Adobe blog post re-capping his main points:
Perfect. My package got wide exposure to the intended audience, which in turn makes it easier to devote time for development and maintenance. The recognition also helped me professionally in that time period, so if I never thanked you publicly Ben, thank you!
Adobe Summit 2015: An Inconspicuous Absence
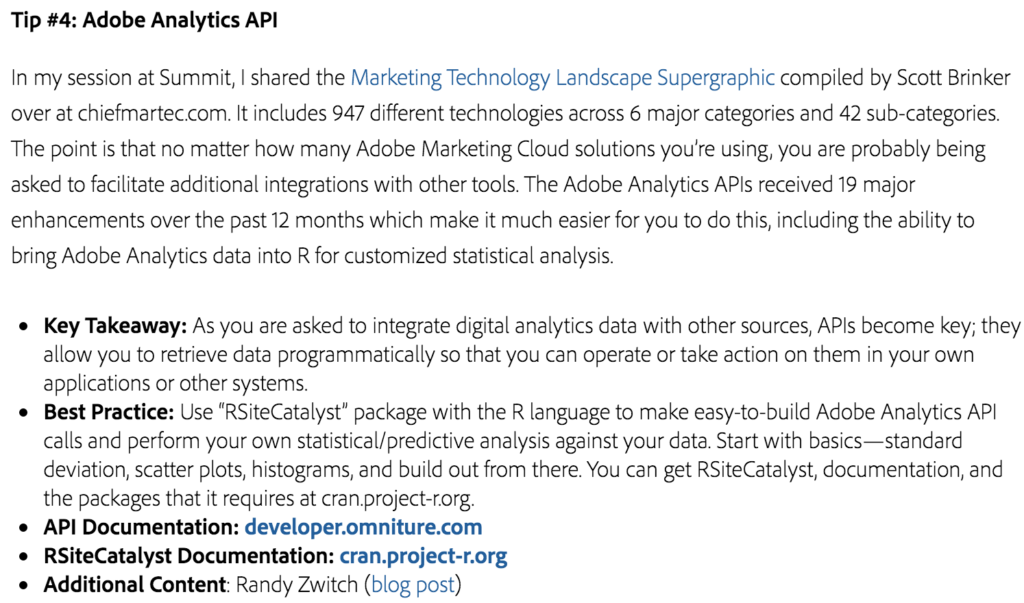
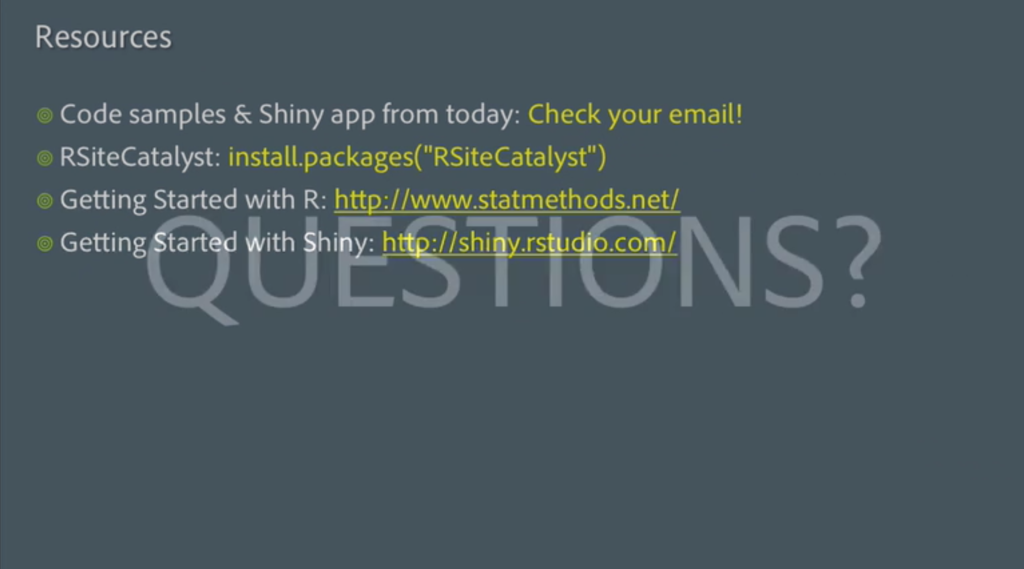
In 2015, RSiteCatalyst moved from a “Tip” to a full-fledged presentation. I was honored when I first heard that an entire hour would be dedicated to reviewing the package, but no attribution was given:
I mean, it was obviously okay to link to non-Adobe websites like statmethods.net (a great reference btw) and to Shiny…but okay, attribution is not a requirement.
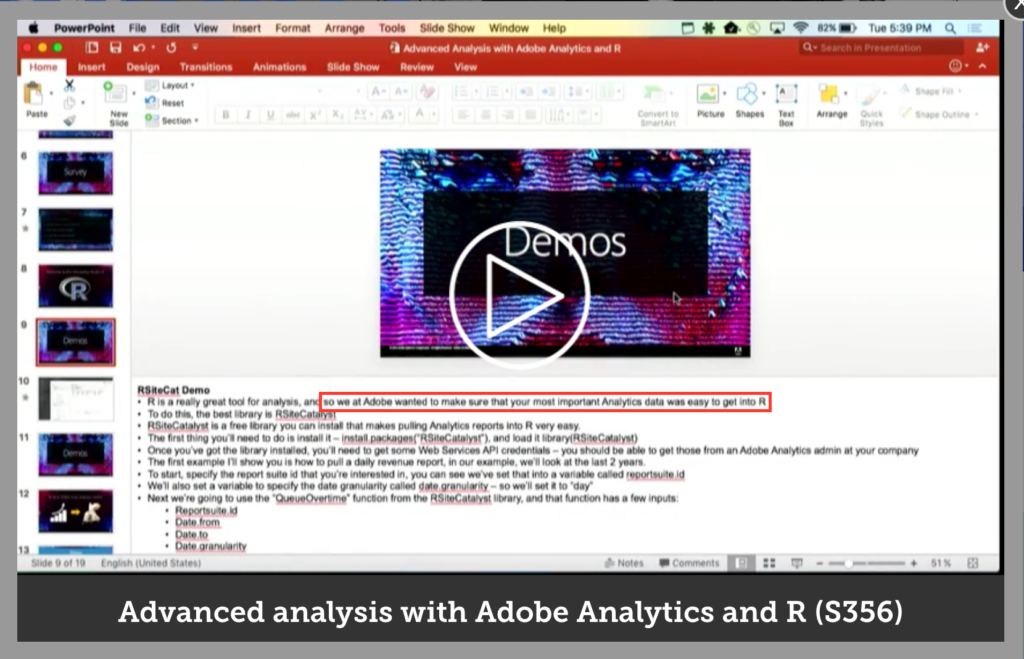
Just so we’re clear, this isn’t me noticing the slide notes in a PDF or PPT I shouldn’t have access to. The screenshot above is directly from the Adobe Summit video and the statement was said nearly verbatim during the presentation. And it’s not like this was a one-off comment…it’s the same damn presentation as 2015, and I KNOW this script went through several rounds of review and practice by the presenters.
It Costs $0 To Do What Is Right
It may be hard for RSiteCatalyst users to believe, but this was the first open-source project I ever wrote AND the means by which I learned how to write R code AND the first time I ever accessed an API. Since then, Willem Paling did an amazing job refactoring/re-writing a majority of the package when the Adobe Analytics API was updated from version 1.3 to 1.4, and there have been numerous other contributions from the user community. Maybe even one day, the repo will reach even 100 stars on GitHub…
But save for a single commit to a README file from an employee, Adobe you have contributed _zero_to the development and maintenance of this package. To claim otherwise is beyond distasteful to the ethos of open-source software. I’ve never asked for compensation of any kind; and again, I recognize that you don’t even need to attribute the work at all.
Just don’t take credit yourselves for providing this functionality to your customers. You did not write RSiteCatalyst Adobe, a community of (unpaid) volunteers did.
As part of getting RSiteCatalyst 1.4.8 ready for CRAN, I’ve managed to accumulate hundreds of testthat tests across 63 test files. Each of these tests runs on Travis CI against an authenticated API, and the API frequently queues long-running reports. Long-story-short, my builds started failing, creating the error log message quoted below:
No output has been received in the last 10m0s, this potentially indicates a stalled build or something wrong with the build itself.
Stalled Build?
The most frustrating about this error is that all my tests run (albeit, a looooong time) successfully through RStudio, so I wasn’t quite sure what the problem was with the Travis CI build. Travis CI does provide a comment about this in their documentation, but even then it didn’t solve my problem:
When a long running command or compile step regularly takes longer than 10 minutes without producing any output, you can adjust your build configuration to take that into consideration.
The shell environment in our build system provides a function that helps to work around that, at least for longer than 10 minutes.
If you have a command that doesn’t produce output for more than 10 minutes, you can prefix it with travis_wait, a function that’s exported by our build environment.
The travis_wait command would work if I were installing packages, but my errors were during tests, so this parameter isn’t the answer. Luckily, testthat provides a test filtering mechanism, providing a solution by allowing the tests to be broken up into smaller chunks.
Regex To The Rescue…
For many applications, the default testthat configuration example will work just well:
R CMD check
Create tests/testthat.R that contains:
library(testthat)
library(yourpackage)
test_check(“yourpackage”)
However, hidden within the test_check() arguments is filter, which will take a regular expression to filter which files in the test folder will get run when the command is triggered by R CMD check. Why is this important? Because each time a new test_check() function gets called, output gets written to stdout, and thus avoids 10 minutes passing without producing any output. Here’s an example of what my successful build logs now look like (GitHub code for the testthat code structure):
You can now see that instead of getting a single output message of Running testthat.R, I have nine separate test files running, none of which take 10 minutes to complete. For my package, each of my test files is labeled based on the function name, and I can end up using really simple regex literals such as the following:
So each file with the word “get” in the filename will be run by this function; I’m not worried about writing complex regexes here, since at worst I my matching is too broad and I run the same test multiple times.
…But Be Careful Of Case-Sensitivity!
The one caveat to simple regex filtering above is that if you’re not careful, you’ll get no match from your test_check() function, which will fail the build on Travis CI. I spent hours trying to figure out why my tests ran fine on OSX, but failed on Travis. Eventually, I even filed an issue against hadley’s repo, feeling silly as soon as I found out that my error was due to case-sensitivity in Linux by not OSX (or Windows for that matter).
So, pay attention, and if all else fails, go with filter = "summary|Summary" or similar to match the case of your filenames!
You Can Never Really Have Too Many Tests
Obviously, the title of this blog post is in jest; Travis CI doesn’t care what you’re running or comments on how many tests you run. But hopefully this blog post provides the answer to the next person down the line running into this issue. Don’t delete your tests, run multiple test_check() functions and the printing every few minutes of the file name to the console should resolve the problem.