With the big release of R 3.0 today comes an unfortunate side effect of needing to re-install all of your packages. Luckily, R provides a pretty easy method of getting all of your packages into a list for automated re-install. Here’s how to do it for OSX users with a default install to the Library:
For Windows users, the same general process should work, assuming you change the file reference in the installed.packages function to the proper Windows location. The one downside to this method is that only packages that are listed on CRAN will be reinstalled, so if you installed anything using devtools, you’ll need to re-install those packages again. But at the very least, the code snippet above is a quick way to re-install most of your packages. EDIT, 4/4/13: Per Noam below, you can also use a more direct method: update.packages(ask=FALSE, checkBuilt = TRUE)
For the last month or so I’ve been working on an R package to make accessing the Adobe (Omniture) Digital Marketing Suite Reporting API easier. As part of this development effort, I’m at the point where I’m intentionally introducing errors into my function inputs, trying to guess some of the ways users might incorrectly input arguments into each function. Imagine my surprise when I saw this:
> result <- content(json) Loading required package: XML Error in parser(content, …) : could not find function “htmlTreeParse” In addition: Warning message: In library(package, lib.loc = lib.loc, character.only = TRUE, logical.return = TRUE, : there is no package called ‘XML’
The main idea behind the functions I’ve written is making REST calls to the Omniture API, which done correctly return valid JSON. From there, each JSON string is converted from binary or whatever formatting they come back as using the content function from the httr package. Without specifying any arguments to the content function, the function tries to guess at the proper translation method.
The guessing is all fine and good until you don’t pass a valid JSON string! In this case, the error message is guessing that it might be XML (the returned error is actually HTML), tries to load the XML package…then says it can’t load the XML package. A two-for-one error!
Maybe it’s just me, but I’m finding this hilarious after a long day of programming. Maybe it’s because I’m not longer intimidated by an error like this, and as such, I’ve gotten over the steep learning curve of R.
Note: Hadley, if you read this, I’m not saying your httr package has any sort of bug or anything. Just that I found this particular error amusing.
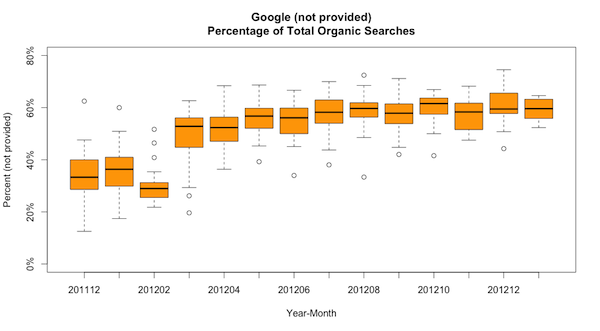
(not provided) terms from Google average 35%-60% of all Google organic search terms
For power users of Google Analytics, there is a heavy dose of spreadsheet work that accompanies any decent analysis. But even with Excel in tow, it’s often difficult to get the data just right without resorting to formula hacks and manual table formatting. This is where the Google Analytics API and R can come very much in handy.
Connecting to the Google Analytics API using R
I’m not going to say that connecting to the Google Analytics API is easy per se, but with the rga package written by “skardhamar” on GitHub, it’s easier than if you had to develop the connection code yourself! However, before you can get started making calls to the Google Analytics API, you need to register within the Google Analytics API console. There you can define a new project and then you’ll be able to make your API calls via R.
After you have your API access straightened out, the GitHub page for the rga package has all the details in how to authenticate using the rga.open function. I chose to use the where argument so that I can continuously hit the API across many sessions without having to do browser authentication each time.
Analyzing (not provided) as a Google Analytics organic search term
Once connected to the Google Analytics API, now it’s time to submit our API calls. I used two API calls to create the graph at the top of the post, which shows the percentage of all Google organic search terms that are listed as “(not provided)” for the entire history of this blog. The two API calls were to download the number of total organic search term visits by date from Google and the number of “(not provided)” visits by date, also from Google. Here’s the API call for the “(not provided)” data (replace XXXXXXXX with your profile ID):
The result of this API call provides an R data frame containing two columns: date and number of visits where the search term was “(not provided)”.
Munging the data using R
After pulling the data into R, all that’s left is to merge the data frames, do a few calculations, then make the boxplot. Because the default object returned by the rga package is a data frame, it’s trivial to use the merge function in R to join the data frames, then use a few calculated columns to create the percentage of visits that are “(not provided)”
What was that Google, only 10% of searches are supposed to be (not provided)?
By now, it’s beating a dead horse that the percentage of “(not provided)” search results from Google FAR exceeds what they said it would. This blog gets about 5,000 visits a month, and due to the technical nature of the blog many of the users are using Chrome (which does secure search automatically) or from iOS (which also does secure search). But at minimum, this graph illustrates the power of using the Google Analytics API via R; I can update this graph at my leisure by running my script, and I can create a graphic that’s not possible within Excel.
#### Connecting to Google Analytics API via R#### Uses OAuth 2.0#### https://developers.google.com/analytics/devguides/reporting/core/v3/ for documentation# Install devtools package & rga - This is only done one timeinstall.packages("devtools")library(devtools)install_github("rga","skardhamar")# Load rga package - requires bitops, RCurl, rjson# Load lubridate to handle dateslibrary(rga)library(lubridate)# Authenticating to GA API. Go to https://code.google.com/apis/console/ and create# an API application. Don't need to worry about the client id and shared secret for# this R code, it is not needed# If file listed in "where" location doesn't exist, browser window will open.# Allow access, copy code into R console where prompted# Once file located in "where" directory created, you will have continous access to# API without needing to do browser authenticationrga.open(instance="ga",where="~/Documents/R/ga-api")# Get (not provided) Search results. Replace XXXXXXXX with your profile ID from GAvisits_notprovided.df<-ga$getData(XXXXXXXX,start.date="2011-01-01",end.date="2013-01-10",metrics="ga:visits",filters="ga:keyword==(not provided);ga:source==google;ga:medium==organic",dimensions="ga:date",max=1500,sort="ga:date")names(visits_notprovided.df)<-c("hit_date","np_visits")# Get sum of all Google Organic Search results. Replace XXXXXXXX with your profile ID from GAvisits_orgsearch.df<-ga$getData(XXXXXXXX,start.date="2011-01-01",end.date="2013-01-10",metrics="ga:visits",filters="ga:source==google;ga:medium==organic",dimensions="ga:date",max=1500,sort="ga:date")names(visits_orgsearch.df)<-c("hit_date","total_visits")# Merge files, create metrics, limit dataset to just days when tags firingmerged.df<-merge(visits_notprovided.df,visits_orgsearch.df,all=TRUE)merged.df$search_term_provided<-merged.df$total_visits-merged.df$np_visitsmerged.df$pct_np<-merged.df$np_visits/merged.df$total_visitsmerged.df$yearmo<-year(merged.df$hit_date)*100+month(merged.df$hit_date)final_dataset=subset(merged.df,total_visits>0)# Visualization - boxplot by month# Main plot, minus y axis tick labelsboxplot(pct_np~yearmo,data=final_dataset,main="Google (not provided)\nPercentage of Total Organic Searches",xlab="Year-Month",ylab="Percent (not provided)",col="orange",ylim=c(0,.8),yaxt="n")#Create tick sequence and format axis labelsticks<-seq(0,.8,.2)label_ticks<-sprintf("%1.f%%",100*ticks)axis(2,at=ticks,labels=label_ticks)