I’ve got PyData NYC 2018 in two days and rather finishing up my talk, I just realized that my source data has a silent corruption due to non-standard timestamps. Here’s how I fixed this using pandas and then uploaded the data to OmniSci.
Computers Are Dumb, MAKE THINGS EASIER FOR THEM!
Literally every data tool in the world can read the ISO-8601 timestamp format. Conversely, not every tool in the world can read Excel or whatever horrible other tool people use to generate the CSV files seen in the wild. While I should’ve been more diligent checking my data ingestion, I didn’t until I created a wonky report…
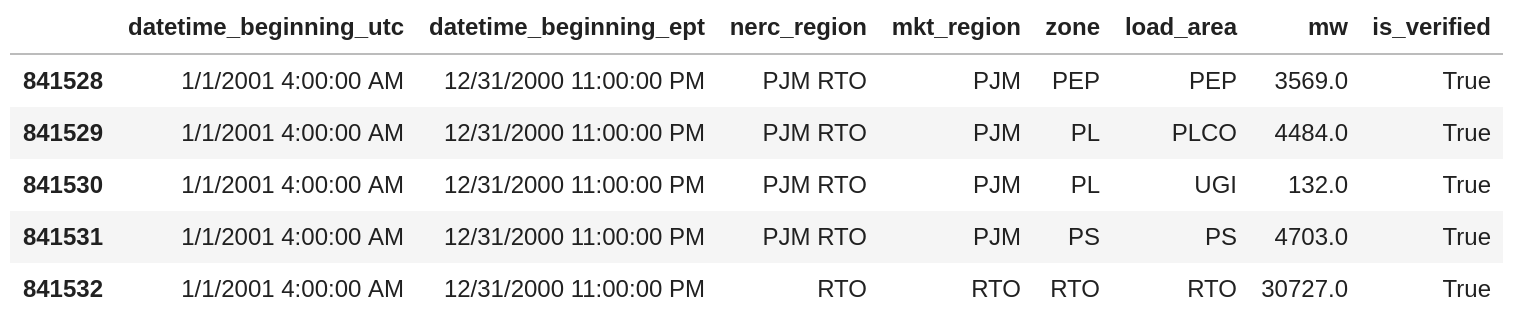
Let’s take a look at the format that tripped me up:
Month/Day/Year Hour:Minute:Second AM/PM feels very much like an Excel date format that you get when Excel is used as a display medium. Unfortunately, when you write CSV files like this, the next tool to read them has to understand 1) that these columns are timestamps and 2) if the user doesn’t specify the format, has to guess the format.
In my case, I didn’t do descriptive statistics on my timestamp columns and had a silent truncation(!) of the AM/PM portion of the data. So instead of having 24 hours in the day, the parser read the data as follows (the #AM and #PM are my comments for clarity):
So while the data looks like it was imported correctly (because, it is a timestamp), it wasn’t until I realized that hours 13-23 were missing from my data that I realized I had an error.
Pandas To The Rescue!
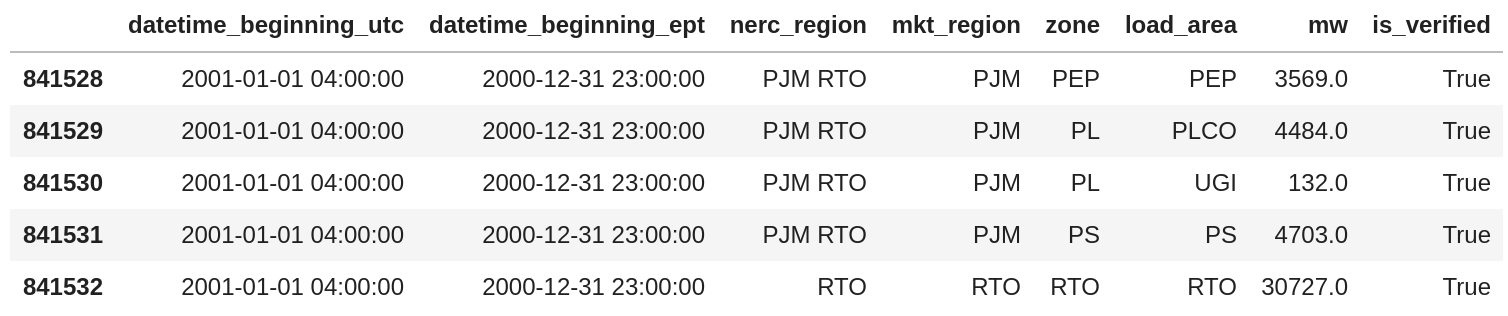
Fixing this issue is as straight-forward as reading the CSV into python using pandas and specifying the date format:
We can see from the code above that pandas has taken our directive about the format and it appears the data have been parsed correctly. A good secondary check here is that the difference in timestamps is -5, which is the offset of the East Coast of the United States relative to UTC.
Uploading to OmniSci Directly From Pandas
Since my PyData talk is going to be using OmniSci, I need to upload this corrected data or rebuild all my work (I’ll opt for fixing my source). Luckily, the pymapd package provides tight integration to an OmniSci database, providing a means of uploading the data directly from a pandas dataframe:
importpymapd#connect to database
conn=pymapd.connect(host="localhost",port=9091,user="mapd",password="HyperInteractive",dbname="mapd")#truncate table so that table definition can be reused
conn.execute("truncate table hrl_load_metered")#re-load data into table
#with none of the optional arguments, pymapd infers that this is an insert operation, since table name exists
conn.load_table_columnar("hrl_load_metered",df)
I have a pre-existing table hrl_load_metered on the database, so I can truncate the table to remove its (incorrect) data but keep the table structure. Then I can use load_table_columnar to insert the cleaned up data into my table and now my data is correct.
Computers May Be Dumb, But Humans Are Lazy
At the beginning, I joked that computers are dumb. Computers are just tools that do exactly what a human programs them to do, and really, it was my laziness that caused this data error. Luckily, I did catch this before my talk and the fix is pretty easy.
I’d like to say I’m going to remember to check my data going forward, but in reality, I’m just documenting this here for the next time I make the same, lazy mistake.
As my Developer Advocate role leads me to doing more and more Sysadmin/Data Engineer type of work, I continuously find myself looking for more efficient ways of copying data folders to where I need them. While there are a lot of great GUI ETL tools out there, for me the simplest and fastest way tends to be using linux utilities. Here’s how to mirror an FTP using lftp, with a cron repeater every five minutes.
Data are on an FTP, Need Further Processing
The problem I have is data that exists on a remote FTP, but are in a binary format that is incompatible with loading directly into OmniSci. My current plan is to use Python to convert the binary format into CSV, but with the data on a server that I don’t control, I need to make a copy somewhere else.
It’s also the case that the data are roughly 300GB per day, streaming in at various intervals across the day, so I need to make sure that any copying I do is thoughtful. Downloading 300GB of data per day is bad enough, doing it multiple times even worse!
lftp mirror to the Rescue!
The best choice in my case seems to be copying the files onto a VM I own. lftp has an option mirror to do just that. Here is the one-liner I’m using:
lftp -e : Execute command in quotes. In this case, the FTP allows anonymous access, so no user/pw arguments needed
mirror: Mirror command for lftp
-c: If download fails for whatever reason, keep trying (c = “continue”)
-e: Delete files on remote that are no longer on source (i.e. keep folders in perfect sync)
--parallel: Allow multiple connections for parallel downloading of multiple files
--verbose: Print lots of messages, helpful for debugging
With all of the flags in place, the last two arguments are the source (remote FTP) and destination (my VM) directories. Finally, I add a quit statement to exit lftp once the mirror process is over. This is mostly hygiene since I plan to run this on a cron scheduler and don’t want to leave the sessions open.
Run This Every Five Minutes, Forever
cron really is one of the greatest timesavers ever, especially in that it allows super-repetitive work to be automated away, usually with a single line. Here is the line I added after calling crontab -e on the command-line:
*/5 **** /home/username/pull_from_ftp.sh
Quite simply, “every 5 minutes, run pull_from_ftp.sh”. Creating pull_from_ftp.sh is as straightforward as creating a text file:
With just a few characters short of a full tweet, you can mirror an entire folder from an FTP, automatically. lftp in combination with cron helped me factor out hundreds of lines of pre-existing Python code, which not only removed untested, copy-pasted code from the workflow but also added parallel downloading, increasing data throughput.
Edit 10/1/2018: When I wrote this blog post, the company and product were named MapD. I’ve changed the title to reflect the new company name, but left the MapD references below to hopefully avoid confusion
In my post Installing MapD on Microsoft Azure, I showed how to install MapD Community Edition on Microsoft Azure, using Ubuntu 16.04 LTS as the base image. One thing I glossed over during the firewall/security section was that I opened ports for Jupyter Notebook and other data science tools, but I didn’t actually show how to install any of those tools.
For this post, I’ll cover how to install MapD ODBC drivers and create a connection within RStudio server.
There are two major ODBC driver managers for Linux and macOS: unixODBC and iODBC. I have had more overall ODBC driver installation success with unixODBC than iODBC; here are the instructions for building unixODBC from source:
#download source and extract
wget ftp://ftp.unixodbc.org/pub/unixODBC/unixODBC-2.3.7.tar.gz
gunzip unixODBC*.tar.gz
tar xvf unixODBC*.tar
#compile and installcd unixODBC-2.3.7
./configure
make
sudo make install
If you want to check everything is installed correctly, you can run the following command:
With unixODBC installed, the next step is to install the MapD ODBC drivers. ODBC drivers for MapD are provided as part of MapD Enterprise Edition, so you’ll need to contact your sales representative to get the appropriate version for your MapD installation.
For Linux, the MapD ODBC drivers are provided as a tarball, which when extracted provides all of the necessary ODBC driver files:
#make a directory to extract files intomkdir mapd_odbc &&cd mapd_odbc
tar-xvf ../mapd_odbc_installer_linux_3.80.1.36.tar.gz
#move to /opt/mapd/mapd_odbc (or wherever the other MapD files are)cd .. &&mv mapd_odbc /opt/mapd/mapd_odbc
By convention, MapD suggests placing the ODBC drivers in the same directory as your installation (frequently, /opt/mapd). Wherever you choose to place the directory, you need add that location into the /etc/odbcinst.ini file:
Depending on your use case/security preferences, there are two downsides to this method: 1) the credentials are in plain-text in the middle of the script and 2) the RStudio Connection window also shows the credentials in connection window in plain-text until you delete the connection. This can be remedied by defining a DSN (data source name).
4. Defining A DSN
A DSN is what people usually think of when installing ODBC drivers, as it holds some/all of the actual details for connecting to the database. DSN files can be placed in two locations: system-wide in /etc/obdc.ini or in an individual user’s home directory (needs to be ~/.odbc.ini, a hidden file).
In order to have the credentials completely masked in the RStudio session, place the following in the /etc/obdc.ini file:
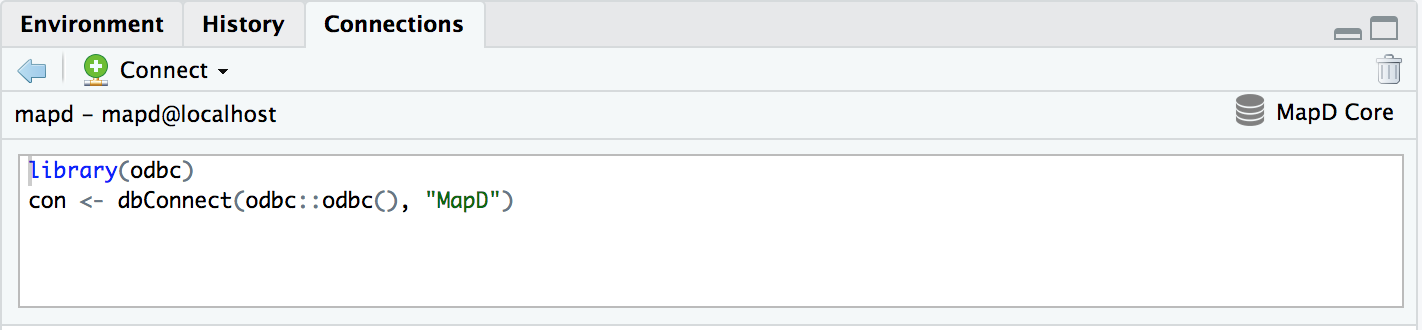
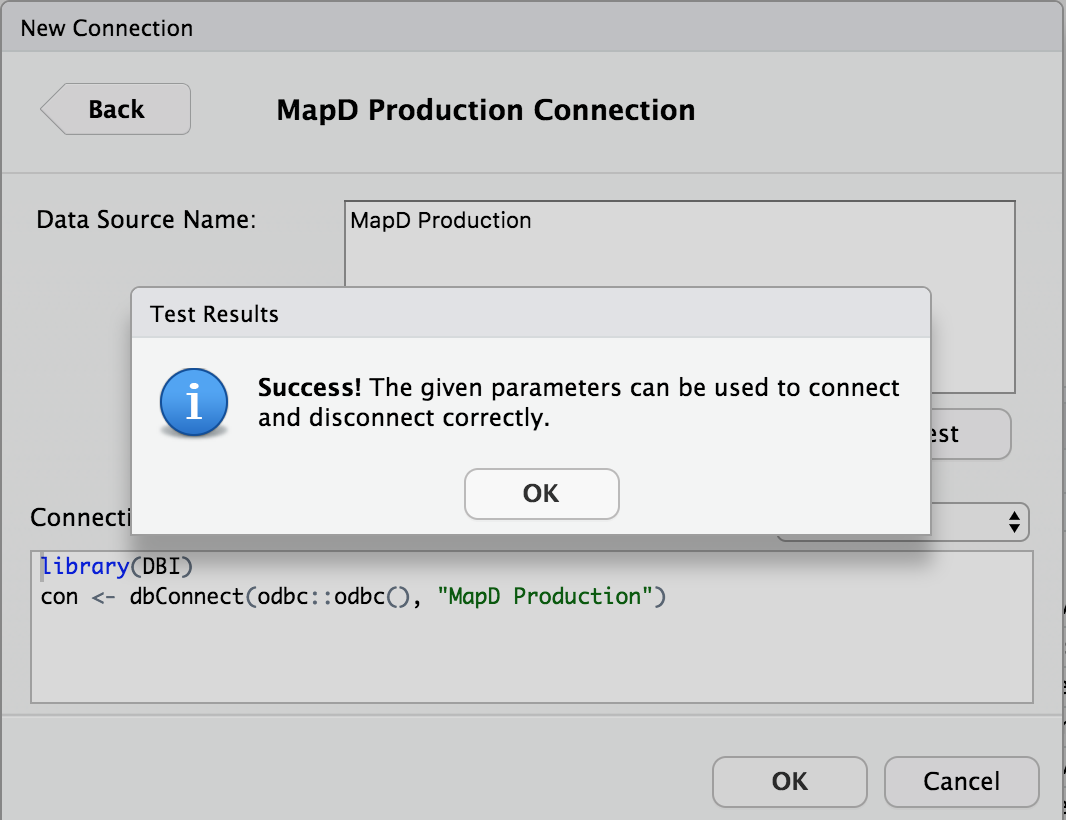
Within the RStudio Connection pane, we can now test our DSN:
With the DSN defined, the R connection code becomes much shorter, with no credentials exposed within the R session:
library(DBI)
con <- dbConnect(odbc::odbc(), "MapD Production")
ODBC: A Big Bag Of Hurt, But Super Useful
While the instructions above aren’t the easiest to work through, once you have ODBC set up and working one time, it’s usually just a matter of appending various credentials to the existing files to add databases.
From a MapD perspective, ODBC is supported through our Enterprise Edition, but it is the slowest way to work with the database. Up to this point, we’ve focused mostly on supporting Python through the pymapd package and the MapD Ibis backend, but there’s no reason technical reason why R can’t also be a first-class citizen.
So if you’re interested in helping develop an R package for MapD, whether using reticulate to wrap pymapd or to help develop Apache Thrift bindings and Apache Arrow native code, send me a Twitter message or connect via LinkedIn (or any other way to contact me) and we’ll figure out how to collaborate!