In my first post in this series, I discussed RStudio, an IDE that adds significant functionality and consistency to a basic installation of R. In this post, I will discuss Rcmdr, a GUI that provides the ability to do basic business statistics without having to code in R.
Rcmdr (“R Commander”)
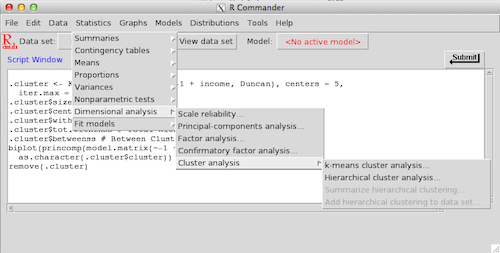
Example Rcmdr window with the "Statistics" menu expanded
Rcmdr is a package for R that was created by John Fox at McMaster University in Canada as a means of providing the basic statistics functionality for classroom use. In this way, Rcmdr is somewhat similar to SAS Enterprise Guide, a GUI that allows quick access to the power of SAS without the requirement of writing code.
While using Rcmdr won’t allow you to tap into every single advanced feature that R provides, it does provide a lot of great “general” functionality that can be used in everyday business such as summary statistics, t-tests, ANOVA, linear regression modeling, graphing and data re-coding.
Using Rcmdr
For the most part, the Rcmdr dialog boxes all look very similar. Only the most useful options are provided, such as the variable(s) you are looking to interrogate, variable(s) you’d like to break down your analysis by, what statistics you want the output to display (mean, median, mode, etc.) and so on. The dialog boxes vary depending on whether you are estimating a model or plotting a graph, but in my preliminary usage I haven’t found any dialog boxes that were so confusing that I needed to check the “Help” files.
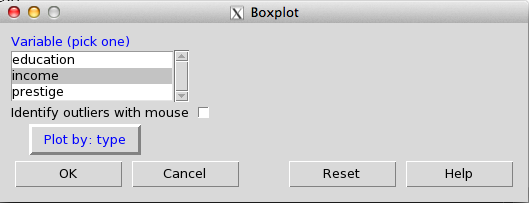
For example, suppose I wanted to make a boxplot of my data, income by job type. To do so, I would go to the “Graphs” menu and select “Boxplot”, which provides me with the following dialog box:
Rcmdr options for creating a Boxplot
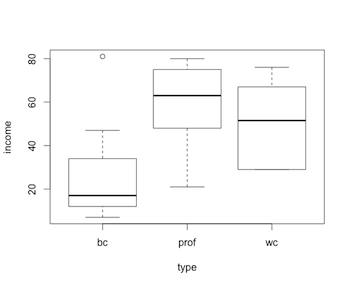
Boxplot output created by Rcmdr
Within this dialog box, there are only 3 choices: variable to plot (income), variable to break down the graph by (type), and “Identify outliers with mouse”, which allows for the user to point at the resulting graph to designate outliers to be labeled on the graph. When I click “OK” in the dialog box, the result is the boxplot shown above. We can see that the “bc” (blue-collar) group has a lower mid-point to the income range than “prof” (professors) and “wc” (white-collar).
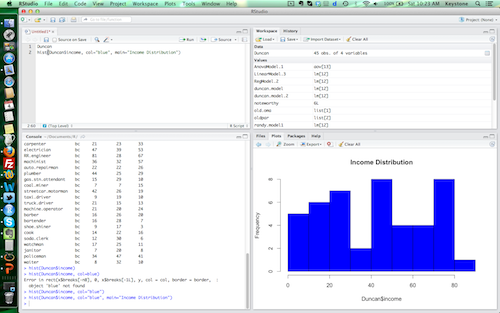
One of the best features of Rcmdr is that not only do we get the output we requested, but the code window also shows the code that was necessary to create the boxplot. In this example, the underlying R code is relatively simple:
By providing the underlying code, Rcmdr serves as a teaching tool to move the beginning user towards coding in R directly, or at least, modifying the tool-generated code to include titles or whatever options the user wants to add to the original analysis/output.
Installation of Rcmdr
Sadly, Rcmdr is one of those add-ins that seems to work better on Windows than Mac OSX, at least for the installation portion. I’ve been able to successfully install Rcmdr on my relatively old MacBook Pro, but it did take a bit of time to figure out. Luckily, the instructions to install Rcmdr on a Mac are fairly well laid out in this article.
However, once you get over the hurdle of downloading tcltk and XQuartz (X11 emulator), the program seems to work the same on both platforms.
Despite my preference for SAS over R, there are some add-ons to “basic” R that I’ve found that have made my learning process way easier. While I’m still in my infancy in learning R, I feel like once I found these additional tools, my ability to use R to get work done improved significantly.
In this first post of three, I’ll discuss RStudio, a more friendly access point to the default installation of R. My second post will discuss Rcmdr, a GUI developed for students taking a basic college-level course in Statistics. The third post will cover rattle, a GUI specifically designed for data mining (as opposed to more general statistics like Rcmdr).
RStudio
R Studio is an IDE that dramatically improves the R experience
RStudio is an open-source Integrated Development Environment (IDE) that provides a more consistent user experience to R. There are many great features of RStudio over “basic” R, including:
Consistent windowing between sessions (customizable by the user)
Point-and-click exploration of data frames and other data objects
Importing data files through dialog box functionality
Customizable code syntax highlighting, auto-complete, and Help menu access from the code editor
Ability to see all installed packages, turn on packages using a checkbox, and download libraries (and their dependencies) without having to write any code
Version Control using GitHub
While RStudio doesn’t provide a GUI that will help you run a regression model or build a graph, it provides a more “friendly” environment to work in as compared to the command-line interface of a default installation of R. I find that by having elements like the currently active data objects and available/active packages with links to the Help files “exposed” at all times, RStudio reminds me of where my analysis has been and gives me a quick way to think about “What Else?” to pursue if I hit a roadblock.
Installation of RStudio
RStudio installs like any other program for Windows or Mac OSX. As far as I can tell, there are no advantages to using RStudio in either environment, both the Windows and OSX versions seem to work equally well. The most important consideration is that RStudio is just an “add-on” so-to-speak, it does not include R itself. So be sure to go to one of the Comprehensive R Archive Network (CRAN) sites to download R first.
EDIT, 9/9/2016: Four years later, this blog post is a comical look back in time. It’s hard to believe that I could think this way! Having used R (and Python, Julia), I will never return back to the constraints of using SAS. The inflexible nature of everything having to be a Dataset in SAS vs. the infinite flexibility of data structures in programming-oriented languages makes it no contest.
But I’ll leave this here to remind myself how today’s frustration leads to tomorrow’s breakthroughs.
For the past 18 months, it seems like all I’ve heard about in the digital marketing industry is “big data”, and with that, mentions of using Hadoop and R to solve these sorts of problems. Why are these tools the most often mentioned? Because they are open source, i.e. free of charge!
But as I’ve tried to learn R, I keep asking myself…are all of my colleagues out of their minds? Or, am I just beyond learning something new? As of right now, R is just one big hack on top of a hack to me, and the software is only “free” if you don’t consider lost productivity.
Need new functionality, just download another R package!
One of the biggest “pros” I see thrown around for R relative to a tool like SAS is that when new statistical techniques are invented, someone will code it in R immediately. A company like SAS make take 5 years to implement the feature, or it may not get implemented at all. That’s all fine and good, but the problem I’ve found is that there are 10 ways to do something in R, and I spend more time downloading packages (along with other packages that are dependencies) than I do learning A SINGLE WAY to do something correctly.
For example, take trying to get summary statistics by group. In SAS, you use a Proc Summary statement, with either a BY group statement or a CLASS statement. It’s fairly simple and it works.
proc summary data= hs0; var _numeric_; class prgtype; output out=results mean= /autolabel autoname inherit; run;
In R, I ran the following code, which should be roughly equivalent:
by(hs0, hs0$prgtype, mean)
Very simple, fewer lines…and technically wrong, throwing a 6 unhelpful errors for a single line of code. Because it was decided that “mean” as a function would be deprecated in R. WHY??? It’s so simple, why modify the language like that?
According to the error message, I’m supposed to use colMeans instead…but once you get to how, you’re on your own, the Help documentation is garbage. Some combination of “by” and “colMeans” might work, but I don’t have an example to follow.
Google sent me to the Quick-R website, and I found a “descriptive statistics” article with by group processing…with the recommendation of using the “psych” package or the “doBy” package. But CRAN won’t let me download all of the dependencies, so again, stuck trying to do the simplest thing in statistics.
Let’s be fast and run everything in RAM!
My next favorite hassle in R is that you are expected to continuously monitor how many data elements you have active in a workspace. R runs completely in RAM (as opposed to SAS which runs a combination of RAM for processing and hard disks for storage), so if you want to do something really “big”, you will quickly choke your computer. I tried to work with a single day of Omniture data from the raw data feed, and my MacBook Pro with 6GB of memory was shot. I believe the file was 700,000 rows by 300 columns, but I could be mis-remembering. That’s not even enough data to think about performance-tuning a program in SAS, any slop code will run quickly.
How does one solve these memory errors in R? Port to Amazon cloud seems to be the most commonly given suggestion. But that’s more setup time, getting an R instance over to Amazon, your data over to Amazon..and now you are renting hardware.
R is great for data visualization!
From what I’ve seen from the demo(graphics) tutorial, R does have some pretty impressive visualization capabilities. Contour maps, histograms, boxplots…there seems to be a lot of capability here beyond the realm of a tool like Excel (which, besides not being free, isn’t really for visualization). SAS has some graphics capabilities, but they are a bit hard to master.
But for all of the hassle to get your data formatted properly, downloading endless packages, avoiding memory errors, you could just pay for Tableau and get working. Then, once you have your visualizations done in Tableau, if you are using Tableau server you can share interactive dashboards with others. As far as I know, R graphics are static image exports, so you’re stuck with “flat” presentations.
Maybe, it’s just me
For R diehards, the above verbiage probably just sounds like whining from someone who is too new to appreciate the greatness of R or too stuck in the “old SAS way”. That’s certainly possible. But from my first several weeks of trying to use R, the level of frustration is way beyond anything I experienced when I was learning SAS.
Luckily, I don’t currently have any consulting projects that require R or SAS at the moment, so I can continue to try and learn why everyone thinks R is so great. But from where I sit right now, the licensing fee from SAS doesn’t seem so bad when it allows me to get to doing productive work instead of building my own statistics software piece-by-piece.