ECDF
The empirical cumulative distribution of values: the fraction of observations at or below each x, as a staircase rising from 0 to 1.
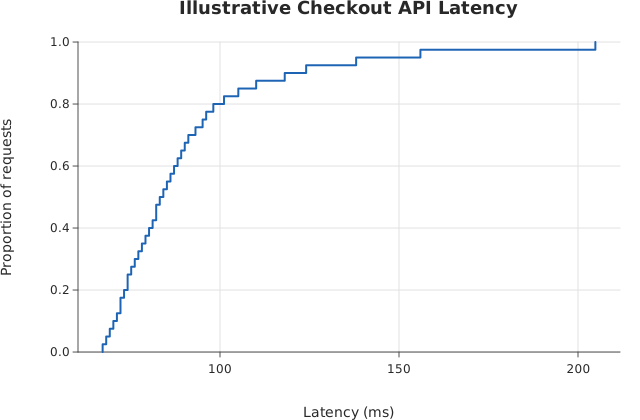
Usage
from dataviz import ecdf
from dataviz import save

def main() raises:
    # The same illustrative right-skewed checkout latency sample used
    # by kdeplot(), rugplot(), and histogram().
    var latency_ms: List[Float64] = [
        84.0, 72.0, 91.0, 68.0, 75.0, 88.0, 79.0, 73.0,
        96.0, 82.0, 77.0, 69.0, 85.0, 74.0, 101.0, 80.0,
        71.0, 93.0, 76.0, 87.0, 83.0, 70.0, 78.0, 89.0,
        81.0, 95.0, 67.0, 86.0, 72.0, 90.0, 110.0, 124.0,
        138.0, 156.0, 205.0, 98.0, 105.0, 118.0, 74.0, 82.0,
    ]
    var c = ecdf(
        latency_ms,
        title="Illustrative Checkout API Latency",
        x_title="Latency (ms)",
        y_title="Proportion of requests",
    )
    save(c, "docs/src/examples/out_ecdf.svg")
See Data shapes for shared input conventions.
Args:
values: The observations, in any order.complementary: Draw the complementary (survival) curve1 - F(x), falling from 1 to 0, instead ofF(x).theme: Colors, sizes and spacing.width: Canvas width in pixels.height: Canvas height in pixels.title: Chart title.subtitle: Smaller line under the title.x_title: X-axis label.y_title: Y-axis label.
Related
Related charts: Rug · Event Plot
Relevant API: ecdf