Triangular Mesh (Colored)
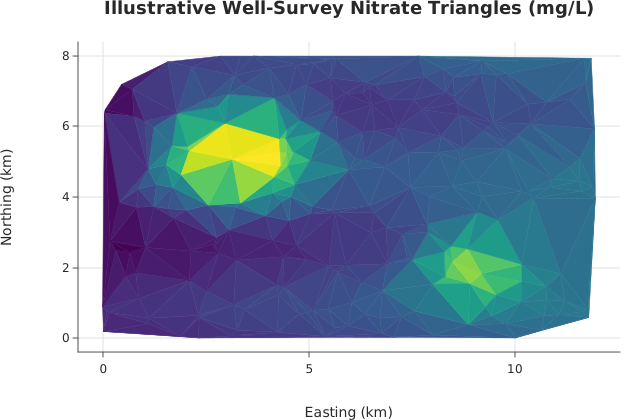
tripcolor() over named columns of a dataframe_mojo DataFrame (#743). Each argument names a column instead of holding the values.
Usage
from std.math import exp, sin

from dataviz import tripcolor
from dataviz.core.colormaps import viridis
from dataviz import Theme
from dataviz import save

def main() raises:
    var x = List[Float64]()
    var y = List[Float64]()
    var z = List[Float64]()
    var seed = 12345
    for _ in range(240):
        seed = (seed * 1103515245 + 12345) % 2147483648
        var px = Float64(seed % 1200) / 100.0
        seed = (seed * 1103515245 + 12345) % 2147483648
        var py = Float64(seed % 800) / 100.0
        x.append(px)
        y.append(py)
        # Same illustrative monitoring-well survey as tricontour()
        # and tricontourf(); each triangle exposes sampling density.
        var farm_x = (px - 3.2) / 1.6
        var farm_y = (py - 5.3) / 1.3
        var plant_x = (px - 9.0) / 1.2
        var plant_y = (py - 2.1) / 1.0
        var nitrate = 1.8 + 0.12 * px + 0.4 * sin(py * 1.7)
        nitrate += 5.8 * exp(-(farm_x * farm_x + farm_y * farm_y))
        nitrate += 3.6 * exp(-(plant_x * plant_x + plant_y * plant_y))
        z.append(nitrate)

    var c = tripcolor(
        x,
        y,
        z,
        theme=Theme(color_ramp=viridis()),
        title="Illustrative Well-Survey Nitrate Triangles (mg/L)",
        x_title="Easting (km)",
        y_title="Northing (km)",
    )
    save(c, "docs/src/examples/out_tripcolor.svg")
See Data shapes for shared input conventions.
Args:
df: The frame to read.x: The numeric column for this channel.y: The numeric column for this channel.z: The numeric column for this channel.gouraud: See the list overload.theme: See the list overload.width: See the list overload.height: See the list overload.title: See the list overload.subtitle: See the list overload.x_title: See the list overload.y_title: See the list overload.
Related
Related charts: Triangular Mesh
Relevant API: tripcolor