Pair Plot
Make a pairplot from named numeric DataFrame columns (#743).
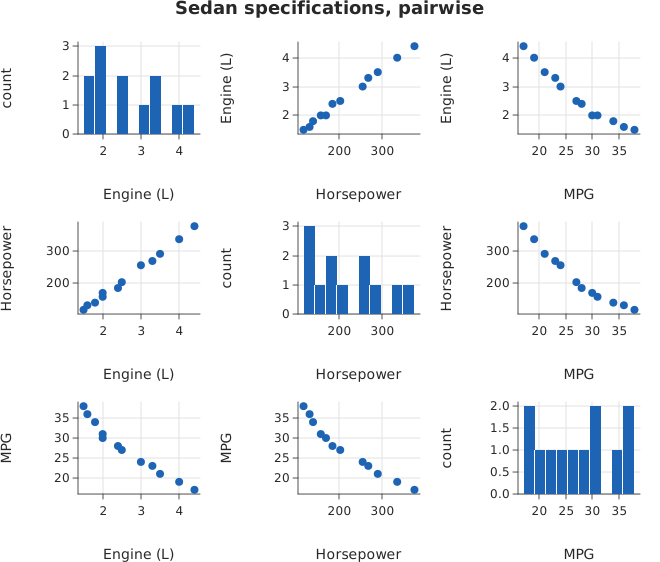
Usage
from dataviz import pairplot, save

def main() raises:
    # Illustrative measurements for a dozen sedans: engine size
    # in liters, horsepower, and highway miles per gallon.
    var columns: List[List[Float64]] = [
        [1.5, 1.6, 1.8, 2.0, 2.0, 2.4, 2.5, 3.0, 3.3, 3.5, 4.0, 4.4],
        [118, 132, 140, 158, 170, 185, 203, 255, 268, 290, 335, 375],
        [38, 36, 34, 31, 30, 28, 27, 24, 23, 21, 19, 17],
    ]
    var c = pairplot(
        columns,
        ["Engine (L)", "Horsepower", "MPG"],
        title="Sedan specifications, pairwise",
    )
    save(c, "docs/src/examples/out_pairplot.svg")
See Data shapes for shared input conventions.
Args:
df: The frame containing the variables.columns: Numeric column names, in display order.theme: Figure styling and missing-value policy.cell_width: Width of each panel in pixels.cell_height: Height of each panel in pixels.bins: Number of bins on each diagonal histogram.title: Figure title.
Related
Related charts: Joint Plot · Clustered Heatmap
Relevant API: pairplot