Voxels
A solid built out of unit cubes: which cells of a 3D grid are filled.
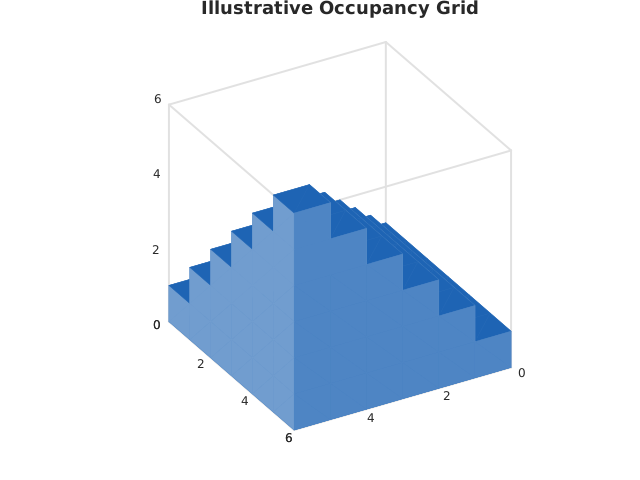
Usage
from dataviz import save, voxels

def main() raises:
    # Illustrative occupancy: a staircase climbing through the
    # grid, so every layer differs from the one below it.
    var grid = List[List[List[Bool]]]()
    for layer in range(6):
        var rows = List[List[Bool]]()
        for row in range(6):
            var cols = List[Bool]()
            for col in range(6):
                cols.append(col >= layer and row >= layer)
            rows.append(cols^)
        grid.append(rows^)

    var c = voxels(grid, title="Illustrative Occupancy Grid")
    save(c, "docs/src/examples/out_voxels.svg")
See Data shapes for shared input conventions.
Args:
filled:filled[layer][row][col],Truewhere the cell is solid. Layers run up z, rows along y, columns along x, and every layer and row must be the same size.elev: Degrees to look down on the scene from, above the x-y plane.azim: Degrees to turn the scene through, about the z axis.theme: Full styling knobs beyond this function’s own parameters – seeTheme’s docstring.width: Pixel width of the returnedPlot(.size()).height: Pixel height of the returnedPlot(.size()).title: The chart’s title, shown above the plot.subtitle: A secondary line shown under the title.
Related
Related charts: 3D Bars · 3D Stems
Relevant API: voxels