Streamlines
streamplot() over a long-form dataframe_mojo DataFrame (#743): one row per grid point, with row and column giving its coordinates and u/v the two components of the vector there.
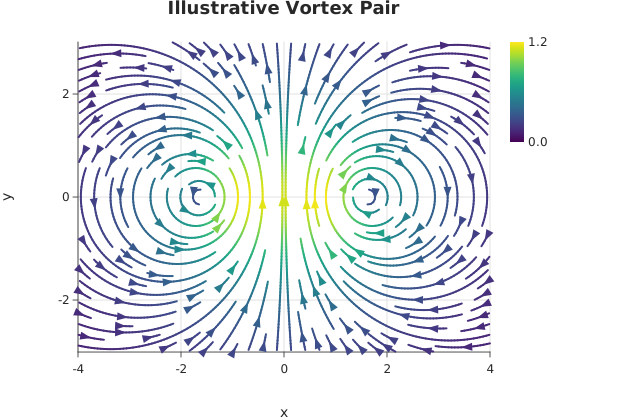
Usage
from dataviz import streamplot, save
from dataviz import Theme
from dataviz.core.colormaps import viridis

def main() raises:
    # A vortex pair: two counter-rotating centers, the flow
    # between them running from one to the other. Sampled on a
    # 33x25 grid over [-4, 4] x [-3, 3].
    var xs = List[Float64]()
    for i in range(33):
        xs.append(-4.0 + 0.25 * Float64(i))
    var ys = List[Float64]()
    for j in range(25):
        ys.append(-3.0 + 0.25 * Float64(j))

    var us = List[List[Float64]]()
    var vs = List[List[Float64]]()
    for j in range(len(ys)):
        var urow = List[Float64]()
        var vrow = List[Float64]()
        for i in range(len(xs)):
            var px = xs[i]
            var py = ys[j]
            # Each center contributes a rotation falling off
            # with the square of the distance to it.
            var ax = px + 1.5
            var ay = py
            var ra = ax * ax + ay * ay + 0.35
            var bx = px - 1.5
            var by = py
            var rb = bx * bx + by * by + 0.35
            urow.append(-ay / ra + by / rb)
            vrow.append(ax / ra - bx / rb)
        us.append(urow^)
        vs.append(vrow^)

    var chart = streamplot(
        xs,
        ys,
        us,
        vs,
        color_by_magnitude=True,
        theme=Theme(color_ramp=viridis()),
        title="Illustrative Vortex Pair",
        x_title="x",
        y_title="y",
    )
    save(chart, "docs/src/examples/out_streamplot.svg")
See Data shapes for shared input conventions.
Args:
df: The frame to read.row: The numeric column giving each point’s row coordinate.column: The numeric column giving each point’s column coordinate.u: The numeric column holding the x component.v: The numeric column holding the y component.density: Line spacing; see the list overload.arrows: Draw direction arrows along each line.color_by_magnitude: Color the lines by speed.theme: Full styling knobs beyond this function’s own parameters.width: Pixel width of the returnedPlot(.size()).height: Pixel height of the returnedPlot(.size()).title: The chart’s title, shown above the plot.subtitle: A line under the title.x_title: The x-axis caption; defaults tocolumn.y_title: The y-axis caption; defaults torow.
Related
Related charts: Vector Arrows · Contour
Relevant API: streamplot