Polar
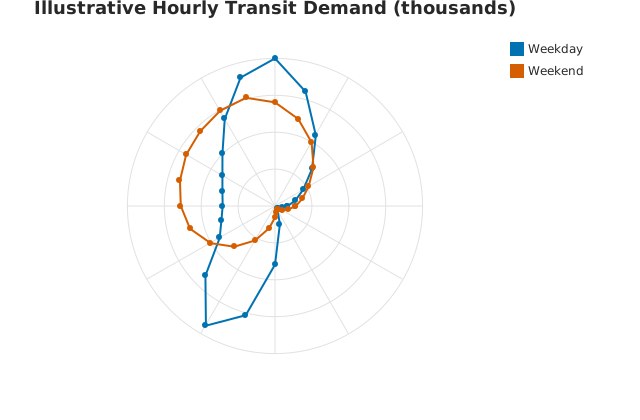
A polar-coordinate line plot: a line series where angle and radius place each point around a circle rather than on x/y axes, for cyclical data (compass headings, time of day, seasonal phase) where a circular layout is the natural fit. For several named series on one angular axis, call polar(angle, series_names, series_values).

Usage
from std.math import pi

from dataviz import polar
from dataviz import save

def main() raises:
    var angle = List[Float64]()
    for hour in range(25):
        angle.append(2.0 * pi * Float64(hour) / 24.0)

    # Illustrative hourly electricity demand (GW); repeat midnight at
    # hour 24 so the daily profile closes around the clock.
    var demand: List[Float64] = [
        22.0, 20.5, 19.4, 18.8, 19.1, 21.7,
        26.8, 31.5, 34.2, 35.8, 36.9, 37.4,
        36.8, 36.1, 35.7, 36.4, 39.2, 43.8,
        46.1, 44.7, 40.3, 34.8, 29.1, 25.0, 22.0,
    ]

    var c = polar(
        angle,
        demand,
        title="Illustrative Weekday Electricity Demand (GW)",
    )
    save(c, "docs/src/examples/out_polar.svg")
Several Series
from std.math import pi

from dataviz import polar
from dataviz import save

def main() raises:
    var angle = List[Float64]()
    for hour in range(25):
        angle.append(2.0 * pi * Float64(hour) / 24.0)

    # Illustrative station entries (thousands) by hour. The final value
    # repeats midnight so each profile closes around the clock.
    var weekday: List[Float64] = [
        1.2, 0.7, 0.4, 0.3, 0.5, 1.8,
        5.6, 10.8, 13.2, 9.4, 6.1, 5.3,
        5.0, 5.2, 5.8, 7.1, 9.6, 12.7,
        14.1, 11.3, 7.8, 5.0, 3.1, 2.0, 1.2,
    ]
    var weekend: List[Float64] = [
        2.0, 1.3, 0.8, 0.5, 0.4, 0.6,
        1.1, 2.2, 3.8, 5.5, 7.1, 8.4,
        9.0, 9.4, 9.8, 10.1, 10.5, 10.7,
        9.9, 8.6, 7.0, 5.2, 3.7, 2.7, 2.0,
    ]
    var names: List[String] = ["Weekday", "Weekend"]
    var values: List[List[Float64]] = [
        weekday.copy(), weekend.copy(),
    ]

    var c = polar(
        angle,
        names,
        values,
        title="Illustrative Hourly Transit Demand (thousands)",
    )
    save(c, "docs/src/examples/out_polar_several_series.svg")
See Data shapes for shared input conventions.
Args:
angle: Radians, used exactly as given and unwrapped – values beyond2*pispiral outward rather than overlapping.radius: Linearly scaled from[0, max(radius)], always zero-anchored at the chart’s center; every value must be non-negative.theme: Full styling knobs beyond this function’s own parameters (colors, margins, fonts, gridlines, …) – seeTheme’s docstring.width: Pixel width of the returnedPlot(.size()).height: Pixel height of the returnedPlot(.size()).title: The chart’s title, shown above the plot.subtitle: A secondary line shown under the title.x_title: The x-axis caption.y_title: The y-axis caption.
Related
Related charts: Radial Bar · Radar
Relevant API: polar