Estimate Points
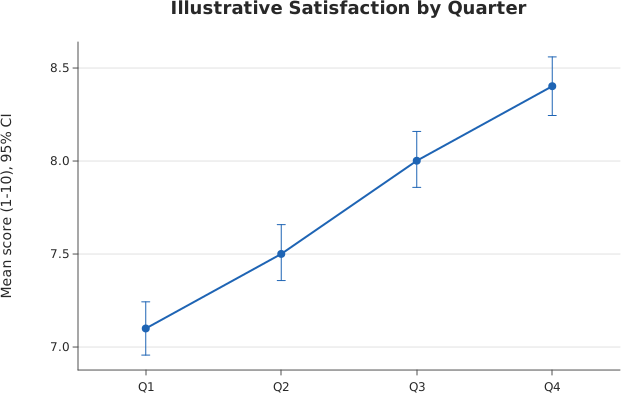
pointplot() over named columns of a dataframe_mojo DataFrame (#743). Each argument names a column instead of holding the values. The axis titles default to the categories and values column names.
Usage
from dataviz import pointplot, save

def main() raises:
    # Illustrative customer-satisfaction scores (1-10) from
    # repeated surveys across four quarters: several responses per
    # quarter, reduced to a mean with its bootstrap 95% confidence
    # interval, joined to show the trend.
    var quarter = List[String]()
    var score = List[Float64]()
    var q: List[List[Float64]] = [
        [7.1, 6.8, 7.4, 7.0, 6.9, 7.3, 7.2],
        [7.4, 7.6, 7.2, 7.8, 7.5, 7.3, 7.7],
        [7.9, 8.2, 7.7, 8.0, 8.3, 7.8, 8.1],
        [8.4, 8.1, 8.6, 8.3, 8.7, 8.2, 8.5],
    ]
    var names: List[String] = ["Q1", "Q2", "Q3", "Q4"]
    for i in range(len(names)):
        for v in q[i]:
            quarter.append(names[i])
            score.append(v)
    var chart = pointplot(
        quarter,
        score,
        title="Illustrative Satisfaction by Quarter",
        y_title="Mean score (1-10), 95% CI",
    )
    save(chart, "docs/src/examples/out_pointplot.svg")
See Data shapes for shared input conventions.
Args:
df: The frame to read.categories: The string column for this channel.values: The numeric column for this channel.estimator: See the list overload.errorbar: See the list overload.seed: See the list overload.theme: See the list overload.width: See the list overload.height: See the list overload.title: See the list overload.subtitle: See the list overload.x_title: See the list overload.y_title: See the list overload.horizontal: See the list overload.
Related
Related charts: Estimate Line · Residual Plot
Relevant API: pointplot