3D Scatter
scatter3d() over named columns of a dataframe_mojo DataFrame (#743). Each argument names a column instead of holding the values.
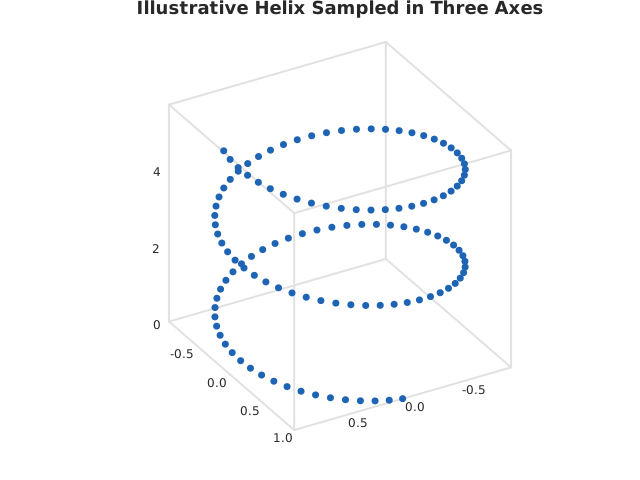
Usage
from std.math import cos, sin

from dataviz import save, scatter3d

def main() raises:
    # Illustrative sampling of a helix climbing through the box.
    var x = List[Float64]()
    var y = List[Float64]()
    var z = List[Float64]()
    for i in range(120):
        var t = Float64(i) * 0.12
        x.append(cos(t))
        y.append(sin(t))
        z.append(Float64(i) * 0.05)

    var c = scatter3d(
        x, y, z, title="Illustrative Helix Sampled in Three Axes"
    )
    save(c, "docs/src/examples/out_scatter3d.svg")
See Data shapes for shared input conventions.
Args:
df: The frame to read.x: The numeric column for this channel.y: The numeric column for this channel.z: The numeric column for this channel.elev: See the list overload.azim: See the list overload.theme: See the list overload.width: See the list overload.height: See the list overload.title: See the list overload.subtitle: See the list overload.
Related
Related charts: 3D Line
Relevant API: scatter3d