Scattered Contour
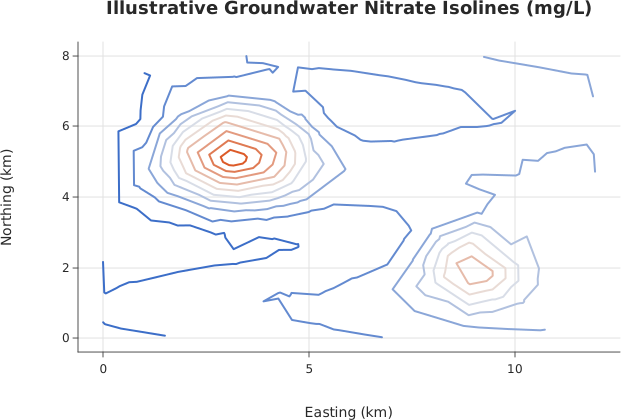
tricontour() over named columns of a dataframe_mojo DataFrame (#743). x, y, and z name columns; levels supplies contour thresholds independently of the rows.
Usage
from std.math import exp, sin

from dataviz import tricontour
from dataviz import save

def main() raises:
    var x = List[Float64]()
    var y = List[Float64]()
    var z = List[Float64]()
    var seed = 12345
    for _ in range(240):
        seed = (seed * 1103515245 + 12345) % 2147483648
        var px = Float64(seed % 1200) / 100.0
        seed = (seed * 1103515245 + 12345) % 2147483648
        var py = Float64(seed % 800) / 100.0
        x.append(px)
        y.append(py)
        # Illustrative nitrate readings from irregular monitoring
        # wells: two localized sources sit on a gentle regional trend.
        var farm_x = (px - 3.2) / 1.6
        var farm_y = (py - 5.3) / 1.3
        var plant_x = (px - 9.0) / 1.2
        var plant_y = (py - 2.1) / 1.0
        var nitrate = 1.8 + 0.12 * px + 0.4 * sin(py * 1.7)
        nitrate += 5.8 * exp(-(farm_x * farm_x + farm_y * farm_y))
        nitrate += 3.6 * exp(-(plant_x * plant_x + plant_y * plant_y))
        z.append(nitrate)

    var c = tricontour(
        x,
        y,
        z,
        level_count=10,
        title="Illustrative Groundwater Nitrate Isolines (mg/L)",
        x_title="Easting (km)",
        y_title="Northing (km)",
    )
    save(c, "docs/src/examples/out_tricontour.svg")
See Data shapes for shared input conventions.
Args:
df: The frame to read.x: The numeric column for this channel.y: The numeric column for this channel.z: The numeric column for this channel.levels: Explicit contour levels; empty useslevel_count.level_count: See the list overload.theme: See the list overload.width: See the list overload.height: See the list overload.title: See the list overload.subtitle: See the list overload.x_title: See the list overload.y_title: See the list overload.
Related
Related charts: Filled Contour · Scattered Contour (Filled)
Relevant API: tricontour