3D Surface
surface3d() over a long-form dataframe_mojo DataFrame (#743): one row per cell, with row and column giving the cell’s coordinates and value its height.
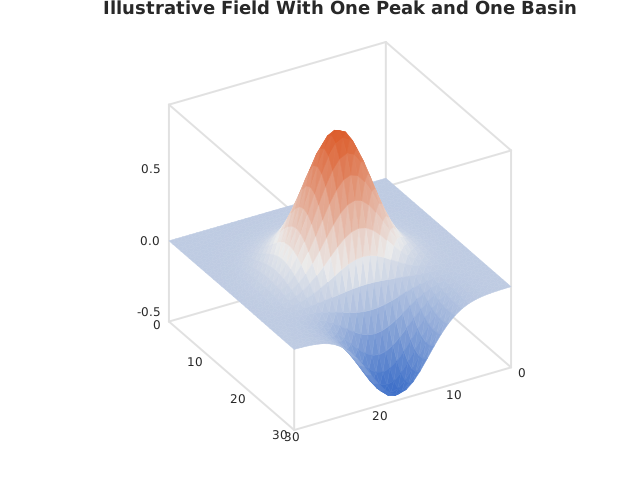
Usage
from std.math import exp

from dataviz import save, surface3d

def main() raises:
    # Illustrative field: a peak beside a shallower basin.
    var z = List[List[Float64]]()
    for r in range(32):
        var row = List[Float64]()
        for c in range(32):
            var u = (Float64(c) - 16.0) / 6.0
            var v = (Float64(r) - 16.0) / 6.0
            row.append(
                exp(-(u * u + v * v))
                - 0.6 * exp(-((u - 2.2) * (u - 2.2) + v * v))
            )
        z.append(row^)

    var c = surface3d(
        z, title="Illustrative Field With One Peak and One Basin"
    )
    save(c, "docs/src/examples/out_surface3d.svg")
See Data shapes for shared input conventions.
Args:
df: The frame to read.row: The numeric column giving each cell’s row coordinate.column: The numeric column giving each cell’s column coordinate.value: The numeric column holding each cell.elev: Degrees to look down on the scene from.azim: Degrees to turn the scene through.theme: Full styling knobs beyond this function’s own parameters.width: Pixel width of the returnedPlot(.size()).height: Pixel height of the returnedPlot(.size()).title: The chart’s title, shown above the plot.subtitle: A line under the title.
Related
Related charts: 3D Line · 3D Wireframe
Relevant API: surface3d