Confidence Band
Confidence Band
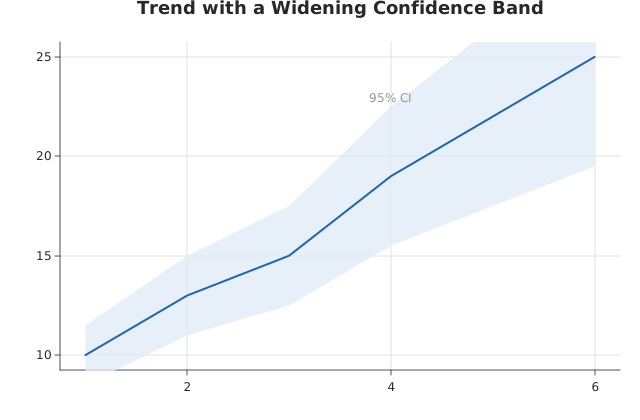
Use this when: You need to shade a confidence/uncertainty band around a trend line with Plot.annotate_band(x, y_lower, y_upper).
Usage
from dataviz import Plot, save


def main() raises:
    var x: List[Float64] = [1.0, 2.0, 3.0, 4.0, 5.0, 6.0]
    var trend: List[Float64] = [10.0, 13.0, 15.0, 19.0, 22.0, 25.0]
    var lower: List[Float64] = [8.5, 11.0, 12.5, 15.5, 17.5, 19.5]
    var upper: List[Float64] = [11.5, 15.0, 17.5, 22.5, 26.5, 30.5]

    var plot = (
        Plot()
        .mark_line()
        .encode(x=x, y=trend)
        .annotate_band(x=x, y_lower=lower, y_upper=upper, label="95% CI")
        .labels(title="Trend with a Widening Confidence Band")
    )
    save(plot, "docs/src/examples/out_annotate_band.svg")
Related
Related recipes: Reference Band · Point Marker
Relevant API: Plot annotations