Ridgeline Overlap
Ridgeline Overlap
Use this when: You need to increase how far a ridgeline’s own row may rise into the row above it.
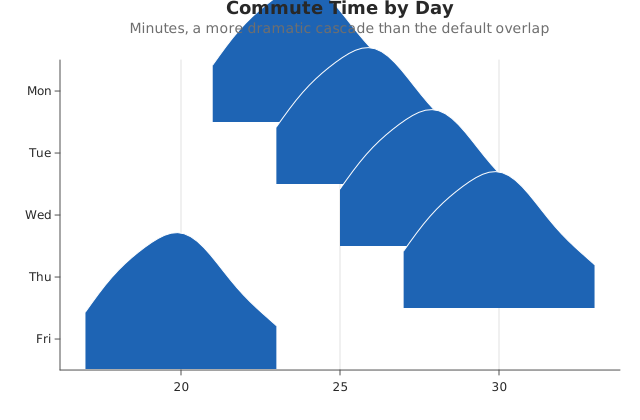
Usage
from dataviz import save, ridgeline


def main() raises:
    var days: List[String] = ["Mon", "Tue", "Wed", "Thu", "Fri"]
    var commute_minutes: List[List[Float64]] = [
        [
            22.0,
            24.0,
            25.0,
            23.0,
            26.0,
            21.0,
            24.0,
            25.0,
            23.0,
            22.0,
            27.0,
            24.0,
        ],
        [
            24.0,
            26.0,
            27.0,
            25.0,
            28.0,
            23.0,
            26.0,
            27.0,
            25.0,
            24.0,
            29.0,
            26.0,
        ],
        [
            26.0,
            28.0,
            29.0,
            27.0,
            30.0,
            25.0,
            28.0,
            29.0,
            27.0,
            26.0,
            31.0,
            28.0,
        ],
        [
            28.0,
            30.0,
            31.0,
            29.0,
            32.0,
            27.0,
            30.0,
            31.0,
            29.0,
            28.0,
            33.0,
            30.0,
        ],
        [
            18.0,
            20.0,
            21.0,
            19.0,
            22.0,
            17.0,
            20.0,
            21.0,
            19.0,
            18.0,
            23.0,
            20.0,
        ],
    ]

    var plot = ridgeline(
        days,
        commute_minutes,
        overlap=2.2,
        title="Commute Time by Day",
        subtitle="Minutes, a more dramatic cascade than the default overlap",
    )
    save(plot, "docs/src/examples/out_ridgeline_overlap.svg")
Related
Related recipes: Scale Violin Width by Count · Dense Corrplot
Relevant API: Plot encodings