Dense Corrplot
Dense Corrplot
Use this when: You need to shrink correlation bubbles to prevent crowding in a dense matrix.
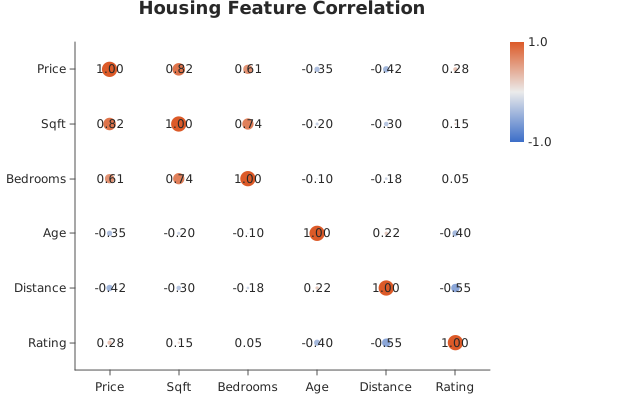
Usage
from dataviz import save, corrplot


def main() raises:
    var variables: List[String] = [
        "Price",
        "Sqft",
        "Bedrooms",
        "Age",
        "Distance",
        "Rating",
    ]
    var matrix: List[List[Float64]] = [
        [1.00, 0.82, 0.61, -0.35, -0.42, 0.28],
        [0.82, 1.00, 0.74, -0.20, -0.30, 0.15],
        [0.61, 0.74, 1.00, -0.10, -0.18, 0.05],
        [-0.35, -0.20, -0.10, 1.00, 0.22, -0.40],
        [-0.42, -0.30, -0.18, 0.22, 1.00, -0.55],
        [0.28, 0.15, 0.05, -0.40, -0.55, 1.00],
    ]

    var plot = corrplot(
        variables,
        matrix,
        bubble_fraction=0.28,
        title="Housing Feature Correlation",
    )
    save(plot, "docs/src/examples/out_dense_corrplot.svg")
Related
Related recipes: Ridgeline Overlap
Relevant API: Plot encodings